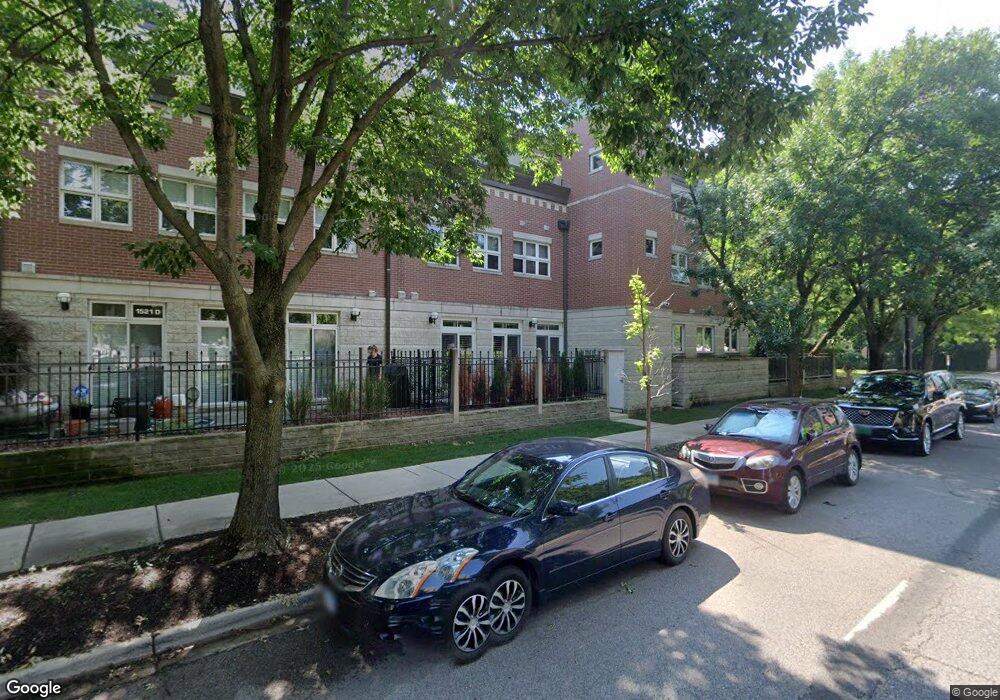
1521 S Indiana Ave Unit C59 Chicago, IL 60605
Central Station NeighborhoodEstimated Value: $388,000 - $562,000
--
Bed
--
Bath
--
Sq Ft
2.47
Acres
About This Home
This home is located at 1521 S Indiana Ave Unit C59, Chicago, IL 60605 and is currently estimated at $491,652. 1521 S Indiana Ave Unit C59 is a home located in Cook County with nearby schools including South Loop Elementary School, Wendell Phillips Academy High School, and Perspectives Chtr - Joslin Campus.
Ownership History
Date
Name
Owned For
Owner Type
Purchase Details
Closed on
Oct 20, 1995
Sold by
Bradley Gregory L and Bradley Carol A
Bought by
Haywood Angela D
Current Estimated Value
Home Financials for this Owner
Home Financials are based on the most recent Mortgage that was taken out on this home.
Original Mortgage
$189,900
Outstanding Balance
$1,334
Interest Rate
7.61%
Estimated Equity
$490,318
Create a Home Valuation Report for This Property
The Home Valuation Report is an in-depth analysis detailing your home's value as well as a comparison with similar homes in the area
Home Values in the Area
Average Home Value in this Area
Purchase History
| Date | Buyer | Sale Price | Title Company |
|---|---|---|---|
| Haywood Angela D | $211,000 | -- |
Source: Public Records
Mortgage History
| Date | Status | Borrower | Loan Amount |
|---|---|---|---|
| Open | Haywood Angela D | $189,900 |
Source: Public Records
Tax History Compared to Growth
Tax History
| Year | Tax Paid | Tax Assessment Tax Assessment Total Assessment is a certain percentage of the fair market value that is determined by local assessors to be the total taxable value of land and additions on the property. | Land | Improvement |
|---|---|---|---|---|
| 2024 | $5,822 | $39,546 | $21,080 | $18,466 |
| 2023 | $5,653 | $30,822 | $16,971 | $13,851 |
| 2022 | $5,653 | $30,822 | $16,971 | $13,851 |
| 2021 | $5,545 | $30,821 | $16,971 | $13,850 |
| 2020 | $5,504 | $27,808 | $12,505 | $15,303 |
| 2019 | $5,375 | $30,183 | $12,505 | $17,678 |
| 2018 | $5,284 | $30,183 | $12,505 | $17,678 |
| 2017 | $5,868 | $30,634 | $10,272 | $20,362 |
| 2016 | $5,635 | $30,634 | $10,272 | $20,362 |
| 2015 | $5,133 | $30,634 | $10,272 | $20,362 |
| 2014 | $3,878 | $23,470 | $9,490 | $13,980 |
| 2013 | $3,790 | $23,470 | $9,490 | $13,980 |
Source: Public Records
Map
Nearby Homes
- 1502 S Prairie Ave Unit B
- 1550 S Indiana Ave Unit P31
- 1478 S Prairie Ave Unit E
- 1525 S Michigan Ave Unit 405
- 1515 S Prairie Ave Unit 910
- 1515 S Prairie Ave Unit 516
- 1515 S Prairie Ave Unit 803
- 1515 S Prairie Ave Unit 1008
- 1600 S Prairie Ave Unit 904
- 1600 S Prairie Ave Unit 1507SS
- 1601 S Michigan Ave Unit 306
- 1601 S Michigan Ave Unit 108
- 1600 S Indiana Ave Unit 908
- 1600 S Indiana Ave Unit P84
- 1600 S Indiana Ave Unit 1503
- 1601 S Indiana Ave Unit 503
- 1441 S Indiana Ave
- 1436 S Prairie Ave Unit I
- 1629 S Prairie Ave Unit 2405
- 1629 S Prairie Ave Unit GU70
- 1521 S Indiana Ave Unit H
- 1521 S Indiana Ave Unit F63
- 1521 S Indiana Ave Unit C65
- 1521 S Indiana Ave Unit C67
- 1521 S Indiana Ave Unit A70
- 1521 S Indiana Ave Unit I71
- 1521 S Indiana Ave Unit J62
- 1521 S Indiana Ave Unit C55
- 1521 S Indiana Ave Unit J64
- 1521 S Indiana Ave Unit H58
- 1521 S Indiana Ave Unit H56
- 1521 S Indiana Ave Unit H66
- 1521 S Indiana Ave Unit F61
- 1521 S Indiana Ave Unit H68
- 1521 S Indiana Ave Unit H60
- 1521 S Indiana Ave Unit H68
- 1521 S Indiana Ave Unit C57
- 1521 S Indiana Ave Unit Q
- 1521 S Indiana Ave Unit M
- 1521 S Indiana Ave Unit P