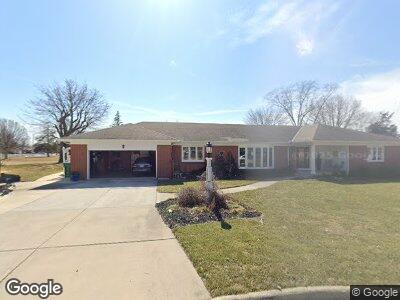
1521 South Ct Findlay, OH 45840
Estimated Value: $310,000 - $349,000
3
Beds
3
Baths
2,709
Sq Ft
$121/Sq Ft
Est. Value
About This Home
This home is located at 1521 South Ct, Findlay, OH 45840 and is currently estimated at $328,337, approximately $121 per square foot. 1521 South Ct is a home located in Hancock County with nearby schools including Wilson Vance Elementary School, Whittier Elementary School, and Donnell Middle School.
Ownership History
Date
Name
Owned For
Owner Type
Purchase Details
Closed on
Jul 23, 2009
Sold by
Roberts James R and Roberts Mary Jane
Bought by
Staley Lisa A and Staley Larry A
Current Estimated Value
Home Financials for this Owner
Home Financials are based on the most recent Mortgage that was taken out on this home.
Original Mortgage
$150,000
Interest Rate
5.43%
Mortgage Type
Purchase Money Mortgage
Purchase Details
Closed on
Jul 2, 1993
Bought by
Roberts Mary Jane
Purchase Details
Closed on
Apr 16, 1993
Bought by
Fitzgerald Dennis M Nomine
Purchase Details
Closed on
Jun 5, 1987
Bought by
Bowman Herbert E and Bowman Beverly
Purchase Details
Closed on
Jun 4, 1987
Bought by
Fitzgerald William T
Purchase Details
Closed on
May 7, 1985
Bought by
Beggs Agnes Ann
Create a Home Valuation Report for This Property
The Home Valuation Report is an in-depth analysis detailing your home's value as well as a comparison with similar homes in the area
Home Values in the Area
Average Home Value in this Area
Purchase History
| Date | Buyer | Sale Price | Title Company |
|---|---|---|---|
| Staley Lisa A | $225,000 | Whitman Title Security | |
| Roberts Mary Jane | $202,400 | -- | |
| Fitzgerald Dennis M Nomine | $197,400 | -- | |
| Bowman Herbert E | $110,800 | -- | |
| Fitzgerald William T | $110,800 | -- | |
| Beggs Agnes Ann | -- | -- |
Source: Public Records
Mortgage History
| Date | Status | Borrower | Loan Amount |
|---|---|---|---|
| Open | Staley Larry A | $167,500 | |
| Closed | Staley Lisa A | $205,000 | |
| Closed | Staley Lisa A | $215,000 | |
| Closed | Staley Lisa A | $66,200 | |
| Closed | Staley Lisa A | $40,000 | |
| Closed | Staley Lisa A | $150,000 | |
| Previous Owner | Roberts James R | $100,000 |
Source: Public Records
Tax History Compared to Growth
Tax History
| Year | Tax Paid | Tax Assessment Tax Assessment Total Assessment is a certain percentage of the fair market value that is determined by local assessors to be the total taxable value of land and additions on the property. | Land | Improvement |
|---|---|---|---|---|
| 2024 | $3,211 | $88,080 | $14,000 | $74,080 |
| 2023 | $3,216 | $88,080 | $14,000 | $74,080 |
| 2022 | $3,123 | $88,080 | $14,000 | $74,080 |
| 2021 | $3,240 | $79,610 | $14,000 | $65,610 |
| 2020 | $3,240 | $79,610 | $14,000 | $65,610 |
| 2019 | $3,175 | $79,610 | $14,000 | $65,610 |
| 2018 | $2,834 | $65,220 | $12,730 | $52,490 |
| 2017 | $2,836 | $65,220 | $12,730 | $52,490 |
| 2016 | $2,790 | $65,220 | $12,730 | $52,490 |
| 2015 | $3,585 | $81,980 | $11,490 | $70,490 |
| 2014 | $3,585 | $81,980 | $11,490 | $70,490 |
| 2012 | $3,494 | $79,380 | $9,100 | $70,280 |
Source: Public Records
Map
Nearby Homes
- 1527 South Ct
- 615 Lincolnshire Ln
- 1205 Glen Meadow Dr
- 1100 Cherry Ln
- 209 E Sawmill Rd
- 524 Sutton Place
- 1300 Woodworth Dr
- 127 Huron Rd
- 1245 Countryside Dr Unit C1
- 717 Balsley Ave
- 1308 Countryside Dr Unit B9
- 2057 Windsor Place
- 309 Huron Rd
- 2009 Saratoga Dr
- 1305 Vincent St
- 2028 Greendale Ave
- 1816 Cherry Ln
- 2 Bright Rd
- 2000 Rush Creek Ct
- 501 Flintlock Ct
- 1521 South Ct
- 1520 South Ct
- 611 E Circle Dr
- 1526 South Ct
- 621 E Circle Dr
- 601 E Circle Dr
- 1521 Greendale Ave
- 613 Canterbury Dr
- 630 Canterbury Dr
- 607 Canterbury Dr
- 631 E Circle Dr
- 619 Canterbury Dr
- 601 Canterbury Dr
- 624 E Circle Dr
- 625 Canterbury Dr
- 600 W Circle Dr
- 537 Canterbury Dr
- 614 Lincolnshire Ln
- 608 Lincolnshire Ln
- 700 E Circle Dr