
Landlord's Agent in 2020
Jeff Wu
Keller Williams Capital Properties
(240) 994-7938
17 in this area
76 Total Sales
Estimated Value: $324,871 - $347,000
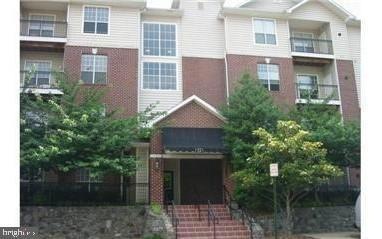
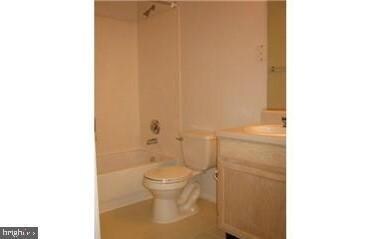
This home is located at 1521 Spring Gate Dr Unit 10414, McLean, VA 22102 since 04 November 2019 and is currently priced at $335,718. This property was built in 1997. 1521 Spring Gate Dr Unit 10414 is a home located in Fairfax County with nearby schools including Westgate Elementary School, Kilmer Middle School, and Marshall High School.
Last Agent to Rent the Property
(240) 994-7938 jeff@agentknowshomes.com Keller Williams Capital Properties Listed on: 11/04/2019
| Date | Buyer | Sale Price | Title Company |
|---|---|---|---|
| Yoo Jong Ho | -- | International Title | |
| Yoo Jung | $215,900 | -- |
| Date | Status | Borrower | Loan Amount |
|---|---|---|---|
| Previous Owner | Yoo Jung | $172,720 |
| Date | Event | Price | List to Sale | Price per Sq Ft |
|---|---|---|---|---|
| 02/10/2020 02/10/20 | Rented | $1,550 | 0.0% | -- |
| 01/06/2020 01/06/20 | For Rent | $1,550 | 0.0% | -- |
| 12/31/2019 12/31/19 | Off Market | $1,550 | -- | -- |
| 11/04/2019 11/04/19 | For Rent | $1,550 | +6.9% | -- |
| 01/10/2019 01/10/19 | Rented | $1,450 | 0.0% | -- |
| 12/03/2018 12/03/18 | For Rent | $1,450 | 0.0% | -- |
| 11/20/2018 11/20/18 | Under Contract | -- | -- | -- |
| 10/24/2018 10/24/18 | For Rent | $1,450 | +3.6% | -- |
| 10/07/2016 10/07/16 | Rented | $1,400 | 0.0% | -- |
| 10/07/2016 10/07/16 | Under Contract | -- | -- | -- |
| 09/13/2016 09/13/16 | For Rent | $1,400 | -- | -- |
| Year | Tax Paid | Tax Assessment Tax Assessment Total Assessment is a certain percentage of the fair market value that is determined by local assessors to be the total taxable value of land and additions on the property. | Land | Improvement |
|---|---|---|---|---|
| 2025 | $3,586 | $320,430 | $64,000 | $256,430 |
| 2024 | $3,586 | $296,690 | $59,000 | $237,690 |
| 2023 | $3,428 | $290,870 | $58,000 | $232,870 |
| 2022 | $3,542 | $296,810 | $59,000 | $237,810 |
| 2021 | $3,631 | $296,810 | $59,000 | $237,810 |
| 2020 | $3,240 | $262,660 | $53,000 | $209,660 |
| 2019 | $3,057 | $247,790 | $50,000 | $197,790 |
| 2018 | $2,743 | $238,550 | $48,000 | $190,550 |
| 2017 | $3,035 | $250,580 | $50,000 | $200,580 |
| 2016 | $3,028 | $250,580 | $50,000 | $200,580 |
| 2015 | $2,922 | $250,580 | $50,000 | $200,580 |
| 2014 | $2,676 | $232,020 | $46,000 | $186,020 |
Landlord's Agent in 2020
Jeff Wu
Keller Williams Capital Properties
(240) 994-7938
17 in this area
76 Total Sales
Tenant's Agent in 2020
Tracy Zhang
Samson Properties
(202) 460-7490
1 in this area
7 Total Sales
Buyer's Agent in 2019
Art Lickunas
Keller Williams Realty Dulles
(703) 541-8200
52 Total Sales
Buyer's Agent in 2016
Tolga Alper
Real Broker, LLC
(703) 835-5881
1 in this area
157 Total Sales
Source: Bright MLS
MLS Number: VAFX1098012
APN: 0294-12100414
Disclaimer: Certain information contained herein is derived from information provided by parties other than Homes.com. All information provided is deemed reliable, but is not guaranteed to be accurate and should be independently verified.
![]() The data relating to real estate for sale on this website appears in part through the BRIGHT Internet Data Exchange program, a voluntary cooperative exchange of property listing data between licensed real estate brokerage firms, and is provided by BRIGHT through a licensing agreement.
The data relating to real estate for sale on this website appears in part through the BRIGHT Internet Data Exchange program, a voluntary cooperative exchange of property listing data between licensed real estate brokerage firms, and is provided by BRIGHT through a licensing agreement.
Listing information is from various brokers who participate in the Bright MLS IDX program and not all listings may be visible on the site.
The property information being provided on or through the website is for the personal, non-commercial use of consumers and such information may not be used for any purpose other than to identify prospective properties consumers may be interested in purchasing.
Some properties which appear for sale on the website may no longer be available because they are for instance, under contract, sold or are no longer being offered for sale.
Property information displayed is deemed reliable but is not guaranteed.
Copyright 2025 Bright MLS, Inc.