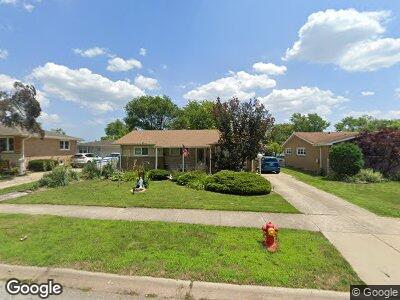
15211 Ridgeway Ave Midlothian, IL 60445
Estimated Value: $219,000 - $249,000
3
Beds
2
Baths
1,244
Sq Ft
$190/Sq Ft
Est. Value
About This Home
This home is located at 15211 Ridgeway Ave, Midlothian, IL 60445 and is currently estimated at $236,722, approximately $190 per square foot. 15211 Ridgeway Ave is a home located in Cook County with nearby schools including Central Park Elementary School, Bremen High School, and St. Christopher School.
Ownership History
Date
Name
Owned For
Owner Type
Purchase Details
Closed on
Oct 20, 2021
Sold by
Knight Norma
Bought by
Esparza Family Trust
Current Estimated Value
Purchase Details
Closed on
Nov 21, 2005
Sold by
Depolo Michael R
Bought by
Knight Norma
Home Financials for this Owner
Home Financials are based on the most recent Mortgage that was taken out on this home.
Original Mortgage
$36,200
Interest Rate
6.2%
Mortgage Type
Stand Alone Second
Purchase Details
Closed on
Jun 30, 2000
Sold by
Messinger Richard A and Messinger Sandra
Bought by
Depolo Michael R
Home Financials for this Owner
Home Financials are based on the most recent Mortgage that was taken out on this home.
Original Mortgage
$75,200
Interest Rate
8.27%
Create a Home Valuation Report for This Property
The Home Valuation Report is an in-depth analysis detailing your home's value as well as a comparison with similar homes in the area
Home Values in the Area
Average Home Value in this Area
Purchase History
| Date | Buyer | Sale Price | Title Company |
|---|---|---|---|
| Esparza Family Trust | -- | None Listed On Document | |
| Knight Norma | $181,000 | Cti | |
| Depolo Michael R | $120,500 | -- |
Source: Public Records
Mortgage History
| Date | Status | Borrower | Loan Amount |
|---|---|---|---|
| Previous Owner | Knight Norma | $36,200 | |
| Previous Owner | Knight Norma | $144,800 | |
| Previous Owner | Depolo Michael R | $93,500 | |
| Previous Owner | Depolo Michael R | $73,500 | |
| Previous Owner | Depolo Michael R | $75,200 |
Source: Public Records
Tax History Compared to Growth
Tax History
| Year | Tax Paid | Tax Assessment Tax Assessment Total Assessment is a certain percentage of the fair market value that is determined by local assessors to be the total taxable value of land and additions on the property. | Land | Improvement |
|---|---|---|---|---|
| 2024 | $3,455 | $17,000 | $2,898 | $14,102 |
| 2023 | $3,455 | $17,000 | $2,898 | $14,102 |
| 2022 | $3,455 | $13,513 | $2,557 | $10,956 |
| 2021 | $3,395 | $13,511 | $2,556 | $10,955 |
| 2020 | $4,477 | $13,511 | $2,556 | $10,955 |
| 2019 | $2,972 | $10,273 | $2,386 | $7,887 |
| 2018 | $2,923 | $10,273 | $2,386 | $7,887 |
| 2017 | $2,842 | $10,273 | $2,386 | $7,887 |
| 2016 | $3,710 | $11,144 | $2,045 | $9,099 |
| 2015 | $3,574 | $11,144 | $2,045 | $9,099 |
| 2014 | $2,744 | $11,144 | $2,045 | $9,099 |
| 2013 | $3,569 | $12,386 | $2,045 | $10,341 |
Source: Public Records
Map
Nearby Homes
- 3719 152nd St
- 15100 Hamlin Ave
- 3612 151st St
- 15241 Millard Ave
- 15303 Birch Rd
- 15100 Avers Ave
- 15321 Birch Rd
- 3519 Roesner Dr
- 15330 Cherry Ln
- 14922 Lawndale Ave
- 3914 153rd St
- 15323 Cherry Ln
- 15412 Hamlin Ave
- 14905 Springfield Ave
- 14959 Willowcrest Ct Unit 15
- 15320 Harding Ave
- 3846 149th St
- 14969 Willowcrest Ct Unit 21
- 14828 Saint Louis Ave
- 3310 Heather Dr
- 15211 Ridgeway Ave
- 15213 Ridgeway Ave
- 15207 Ridgeway Ave
- 15215 Ridgeway Ave
- 15202 Lawndale Ave
- 15212 Lawndale Ave
- 15201 Ridgeway Ave
- 15214 Lawndale Ave
- 15217 Ridgeway Ave
- 15210 Ridgeway Ave
- 15212 Ridgeway Ave
- 15214 Ridgeway Ave
- 15216 Lawndale Ave
- 15221 Ridgeway Ave
- 15216 Ridgeway Ave
- 3725 152nd St
- 15220 Lawndale Ave
- 15218 Ridgeway Ave
- 3642 152nd Place
- 15223 Ridgeway Ave