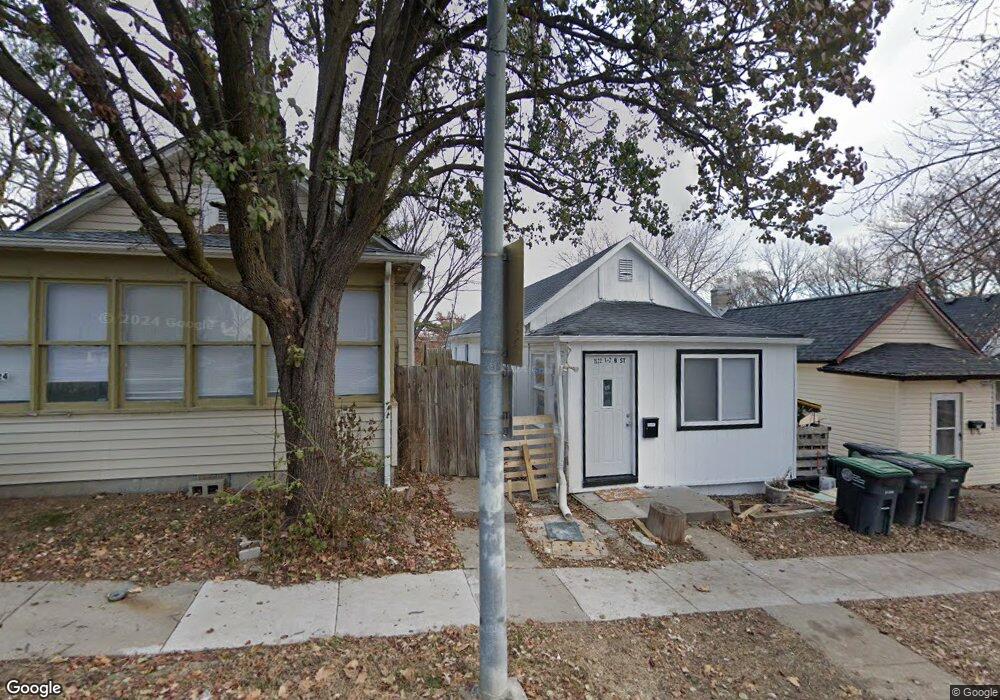
1522 1/2 B St Omaha, NE 68108
South Central Omaha NeighborhoodEstimated Value: $93,000 - $137,000
2
Beds
1
Bath
700
Sq Ft
$157/Sq Ft
Est. Value
About This Home
This home is located at 1522 1/2 B St, Omaha, NE 68108 and is currently estimated at $109,647, approximately $156 per square foot. 1522 1/2 B St is a home located in Douglas County with nearby schools including Bancroft Elementary School, R.M. Marrs Magnet Middle School, and South High Magnet School.
Ownership History
Date
Name
Owned For
Owner Type
Purchase Details
Closed on
May 15, 2018
Sold by
Just Right Homes Llc
Bought by
Dela Cruz Eduardo Hernandez
Current Estimated Value
Home Financials for this Owner
Home Financials are based on the most recent Mortgage that was taken out on this home.
Original Mortgage
$37,000
Outstanding Balance
$19,192
Interest Rate
4.4%
Mortgage Type
Unknown
Estimated Equity
$90,455
Purchase Details
Closed on
Jun 9, 2010
Sold by
Merriman John L and Johnson Michelle Renee Merriman
Bought by
Just Right Homes Llc
Create a Home Valuation Report for This Property
The Home Valuation Report is an in-depth analysis detailing your home's value as well as a comparison with similar homes in the area
Home Values in the Area
Average Home Value in this Area
Purchase History
| Date | Buyer | Sale Price | Title Company |
|---|---|---|---|
| Dela Cruz Eduardo Hernandez | $37,000 | None Available | |
| Just Right Homes Llc | $31,000 | Brokers Title & Escrow Svcs |
Source: Public Records
Mortgage History
| Date | Status | Borrower | Loan Amount |
|---|---|---|---|
| Open | Dela Cruz Eduardo Hernandez | $37,000 |
Source: Public Records
Tax History
| Year | Tax Paid | Tax Assessment Tax Assessment Total Assessment is a certain percentage of the fair market value that is determined by local assessors to be the total taxable value of land and additions on the property. | Land | Improvement |
|---|---|---|---|---|
| 2025 | $963 | $58,800 | $10,200 | $48,600 |
| 2024 | $1,156 | $58,800 | $10,200 | $48,600 |
| 2023 | $1,156 | $54,800 | $10,200 | $44,600 |
| 2022 | $1,108 | $51,900 | $7,300 | $44,600 |
| 2021 | $963 | $45,500 | $7,300 | $38,200 |
| 2020 | $974 | $45,500 | $7,300 | $38,200 |
| 2019 | $941 | $43,800 | $7,300 | $36,500 |
| 2018 | $845 | $39,300 | $7,300 | $32,000 |
| 2017 | $556 | $25,900 | $3,500 | $22,400 |
| 2016 | $556 | $25,900 | $3,500 | $22,400 |
| 2015 | $548 | $25,900 | $3,500 | $22,400 |
| 2014 | $548 | $25,900 | $3,500 | $22,400 |
Source: Public Records
Map
Nearby Homes
Your Personal Tour Guide
Ask me questions while you tour the home.