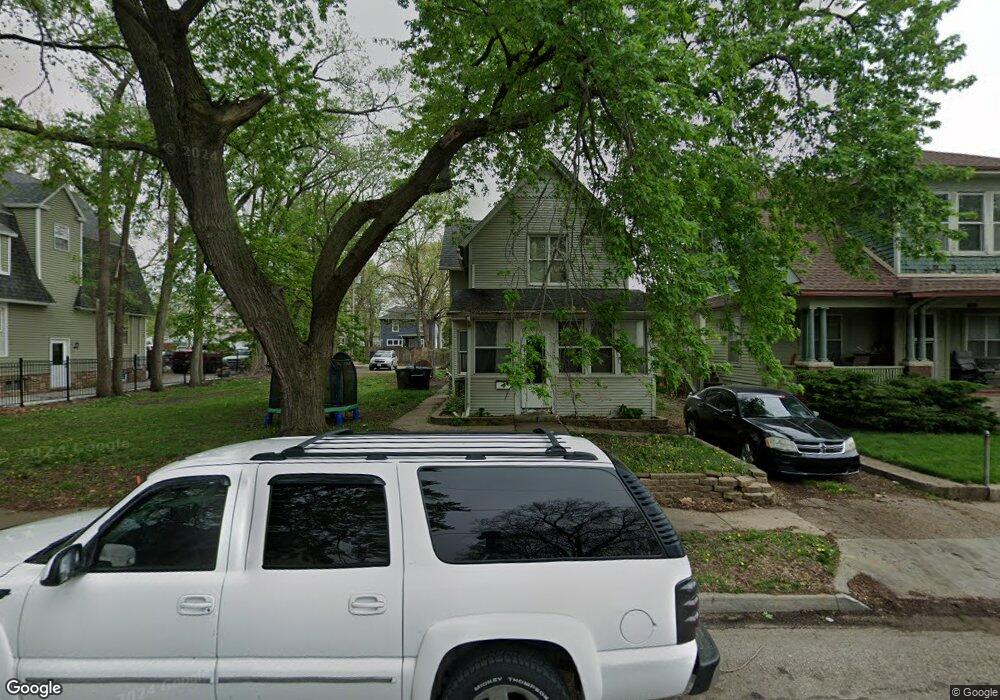
1522 11th St Des Moines, IA 50314
King Irving NeighborhoodEstimated Value: $153,835 - $237,000
3
Beds
1
Bath
1,735
Sq Ft
$104/Sq Ft
Est. Value
About This Home
This home is located at 1522 11th St, Des Moines, IA 50314 and is currently estimated at $181,209, approximately $104 per square foot. 1522 11th St is a home located in Polk County with nearby schools including Moulton Elementary School, Harding Middle School, and North High School.
Ownership History
Date
Name
Owned For
Owner Type
Purchase Details
Closed on
Oct 11, 2024
Sold by
Hall Kathleen M and Hall Ralph Cornelius
Bought by
Hall Ralph Cornelius
Current Estimated Value
Purchase Details
Closed on
Mar 18, 2022
Sold by
Old Grove Investments Llc
Bought by
Ramirez Enrique
Purchase Details
Closed on
Dec 14, 2021
Sold by
Hall Kathleen M
Bought by
Hall Kathleen M and Hall Ralph Cornelius
Purchase Details
Closed on
Jun 3, 1998
Sold by
Neighborhood Housing Svcs Of Des Moines
Bought by
Hall Kathleen M
Create a Home Valuation Report for This Property
The Home Valuation Report is an in-depth analysis detailing your home's value as well as a comparison with similar homes in the area
Home Values in the Area
Average Home Value in this Area
Purchase History
| Date | Buyer | Sale Price | Title Company |
|---|---|---|---|
| Hall Ralph Cornelius | -- | None Listed On Document | |
| Ramirez Enrique | -- | None Listed On Document | |
| Hall Kathleen M | -- | Abendroth Russell Barnett Law | |
| Hall Kathleen M | $55,000 | -- |
Source: Public Records
Tax History Compared to Growth
Tax History
| Year | Tax Paid | Tax Assessment Tax Assessment Total Assessment is a certain percentage of the fair market value that is determined by local assessors to be the total taxable value of land and additions on the property. | Land | Improvement |
|---|---|---|---|---|
| 2025 | $1,890 | $124,000 | $8,800 | $115,200 |
| 2024 | $1,890 | $106,500 | $7,500 | $99,000 |
| 2023 | $1,630 | $106,500 | $7,500 | $99,000 |
| 2022 | $1,614 | $78,000 | $5,700 | $72,300 |
| 2021 | $1,498 | $78,000 | $5,700 | $72,300 |
| 2020 | $1,550 | $68,600 | $5,100 | $63,500 |
| 2019 | $1,442 | $68,600 | $5,100 | $63,500 |
| 2018 | $1,422 | $62,200 | $4,500 | $57,700 |
| 2017 | $1,452 | $62,200 | $4,500 | $57,700 |
| 2016 | $1,410 | $62,200 | $4,500 | $57,700 |
| 2015 | $1,410 | $62,200 | $4,500 | $57,700 |
| 2014 | $1,236 | $55,200 | $4,400 | $50,800 |
Source: Public Records
Map
Nearby Homes