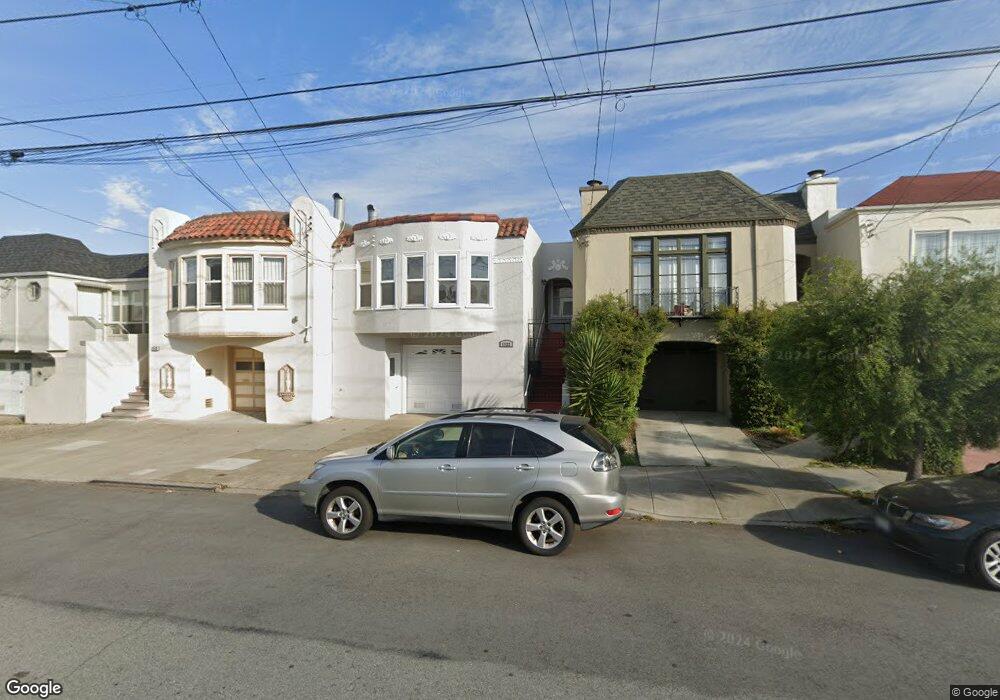
1522 25th Ave Unit 3 San Francisco, CA 94122
Central Sunset NeighborhoodEstimated Value: $1,429,000 - $1,612,000
--
Bed
1
Bath
1,300
Sq Ft
$1,172/Sq Ft
Est. Value
About This Home
This home is located at 1522 25th Ave Unit 3, San Francisco, CA 94122 and is currently estimated at $1,524,012, approximately $1,172 per square foot. 1522 25th Ave Unit 3 is a home located in San Francisco County with nearby schools including Jefferson Elementary School, Giannini (A.P.) Middle School, and Cornerstone Academy-Lawton Campus.
Ownership History
Date
Name
Owned For
Owner Type
Purchase Details
Closed on
Aug 12, 2016
Sold by
Kwang Patrice Kit Mun and Kwang Patrice
Bought by
Kwang Patrice Kiy Mun and Patrice Kwang Living Trust
Current Estimated Value
Purchase Details
Closed on
Nov 11, 2012
Sold by
Chan Christine
Bought by
Kwang Patrice
Purchase Details
Closed on
Mar 10, 2011
Sold by
Kwang Toby and Kwang Toby Chuk Toa
Bought by
Kwang Toby
Purchase Details
Closed on
Nov 19, 2009
Sold by
Homesales Inc
Bought by
Montano Mauricio J
Home Financials for this Owner
Home Financials are based on the most recent Mortgage that was taken out on this home.
Original Mortgage
$267,200
Outstanding Balance
$174,560
Interest Rate
5.01%
Mortgage Type
New Conventional
Estimated Equity
$1,349,452
Purchase Details
Closed on
Nov 28, 2008
Sold by
Wong Steven C
Bought by
Homesales Inc
Purchase Details
Closed on
Mar 22, 2004
Sold by
Kwang Wai Hing
Bought by
Kwang Wai Hing and Kwang Man Kun
Create a Home Valuation Report for This Property
The Home Valuation Report is an in-depth analysis detailing your home's value as well as a comparison with similar homes in the area
Home Values in the Area
Average Home Value in this Area
Purchase History
| Date | Buyer | Sale Price | Title Company |
|---|---|---|---|
| Kwang Patrice Kiy Mun | -- | None Available | |
| Kwang Patrice | -- | None Available | |
| Kwang Toby | -- | None Available | |
| Montano Mauricio J | -- | First American Title Ofs | |
| Homesales Inc | $488,660 | None Available | |
| Kwang Wai Hing | -- | -- |
Source: Public Records
Mortgage History
| Date | Status | Borrower | Loan Amount |
|---|---|---|---|
| Open | Montano Mauricio J | $267,200 |
Source: Public Records
Tax History Compared to Growth
Tax History
| Year | Tax Paid | Tax Assessment Tax Assessment Total Assessment is a certain percentage of the fair market value that is determined by local assessors to be the total taxable value of land and additions on the property. | Land | Improvement |
|---|---|---|---|---|
| 2025 | $7,790 | $609,541 | $422,579 | $186,962 |
| 2024 | $7,790 | $597,592 | $414,294 | $183,298 |
| 2023 | $7,666 | $585,876 | $406,171 | $179,705 |
| 2022 | $7,509 | $574,391 | $398,208 | $176,183 |
| 2021 | $7,373 | $563,131 | $390,401 | $172,730 |
| 2020 | $7,470 | $557,360 | $386,400 | $170,960 |
| 2019 | $7,219 | $546,435 | $378,825 | $167,610 |
| 2018 | $6,974 | $535,723 | $371,398 | $164,325 |
| 2017 | $6,594 | $525,222 | $364,117 | $161,105 |
| 2016 | $6,464 | $514,926 | $356,979 | $157,947 |
| 2015 | $6,380 | $507,195 | $351,619 | $155,576 |
| 2014 | $6,214 | $497,263 | $344,733 | $152,530 |
Source: Public Records
Map
Nearby Homes
- 1458 25th Ave
- 2015-2017 Judah St
- 1647 24th Ave
- 1678 24th Ave
- 1826 Moraga St
- 1616 Judah St
- 1483 19th Ave
- 1675 29th Ave
- 1771 23rd Ave
- 1735 28th Ave
- 1688 20th Ave Unit 1688
- 1726 30th Ave
- 1346 Judah St
- 2615 Lincoln Way
- 1850 23rd Ave
- 1233 20th Ave
- 1255-1257 19th Ave
- 1349 17th Ave
- 1942 24th Ave
- 1200 Ortega St Unit 1202