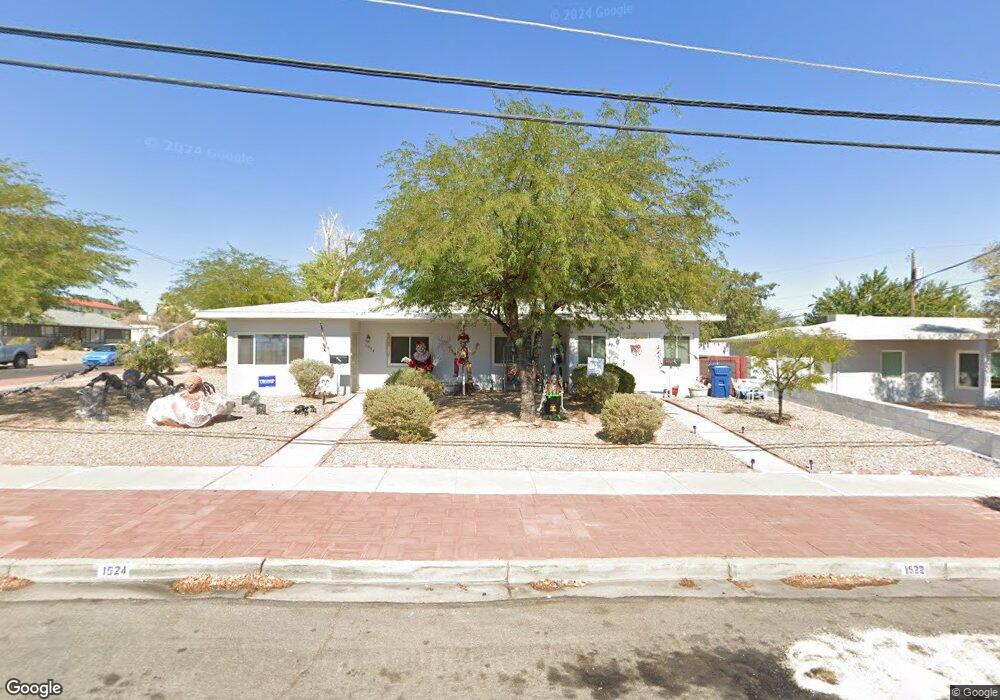
1522 5th St Boulder City, NV 89005
Estimated Value: $455,000 - $497,000
3
Beds
2
Baths
1,541
Sq Ft
$306/Sq Ft
Est. Value
About This Home
This home is located at 1522 5th St, Boulder City, NV 89005 and is currently estimated at $471,176, approximately $305 per square foot. 1522 5th St is a home located in Clark County with nearby schools including Andrew Mitchell Elementary School, Martha P. King Elementary School, and Elton M. & Madelaine E. Garrett Junior High School.
Ownership History
Date
Name
Owned For
Owner Type
Purchase Details
Closed on
Oct 6, 2006
Sold by
Dube Edmond A and Dube Mary Ann
Bought by
Dube Edmond A and Dube Mary Ann
Current Estimated Value
Purchase Details
Closed on
Feb 11, 2003
Sold by
Egan William M and Egan Barbara M
Bought by
Cafiero Mary Ann and Dube Edmond A
Home Financials for this Owner
Home Financials are based on the most recent Mortgage that was taken out on this home.
Original Mortgage
$155,000
Outstanding Balance
$65,462
Interest Rate
5.76%
Estimated Equity
$405,714
Purchase Details
Closed on
Mar 3, 2000
Sold by
Young Richard P and Young Sharon J
Bought by
Egan William M and Egan Barbara M
Home Financials for this Owner
Home Financials are based on the most recent Mortgage that was taken out on this home.
Original Mortgage
$129,200
Interest Rate
8.21%
Purchase Details
Closed on
Nov 26, 1995
Sold by
Keele Harold R and Keele Valerie L
Bought by
Young Richard P and Young Sharon J
Create a Home Valuation Report for This Property
The Home Valuation Report is an in-depth analysis detailing your home's value as well as a comparison with similar homes in the area
Home Values in the Area
Average Home Value in this Area
Purchase History
| Date | Buyer | Sale Price | Title Company |
|---|---|---|---|
| Dube Edmond A | -- | None Available | |
| Cafiero Mary Ann | $190,000 | Nevada Title Company | |
| Egan William M | $161,500 | United Title | |
| Young Richard P | $120,000 | United Title |
Source: Public Records
Mortgage History
| Date | Status | Borrower | Loan Amount |
|---|---|---|---|
| Open | Cafiero Mary Ann | $155,000 | |
| Previous Owner | Egan William M | $129,200 |
Source: Public Records
Tax History Compared to Growth
Tax History
| Year | Tax Paid | Tax Assessment Tax Assessment Total Assessment is a certain percentage of the fair market value that is determined by local assessors to be the total taxable value of land and additions on the property. | Land | Improvement |
|---|---|---|---|---|
| 2025 | $1,198 | $77,408 | $57,750 | $19,658 |
| 2024 | $1,109 | $77,408 | $57,750 | $19,658 |
| 2023 | $1,109 | $57,467 | $40,425 | $17,042 |
| 2022 | $1,027 | $50,754 | $34,913 | $15,841 |
| 2021 | $951 | $41,097 | $28,700 | $12,397 |
| 2020 | $883 | $41,374 | $28,700 | $12,674 |
| 2019 | $827 | $38,548 | $26,250 | $12,298 |
| 2018 | $789 | $34,208 | $22,750 | $11,458 |
| 2017 | $842 | $32,234 | $21,000 | $11,234 |
| 2016 | $738 | $28,440 | $17,500 | $10,940 |
| 2015 | $737 | $28,077 | $17,500 | $10,577 |
| 2014 | $723 | $28,497 | $17,500 | $10,997 |
Source: Public Records
Map
Nearby Homes