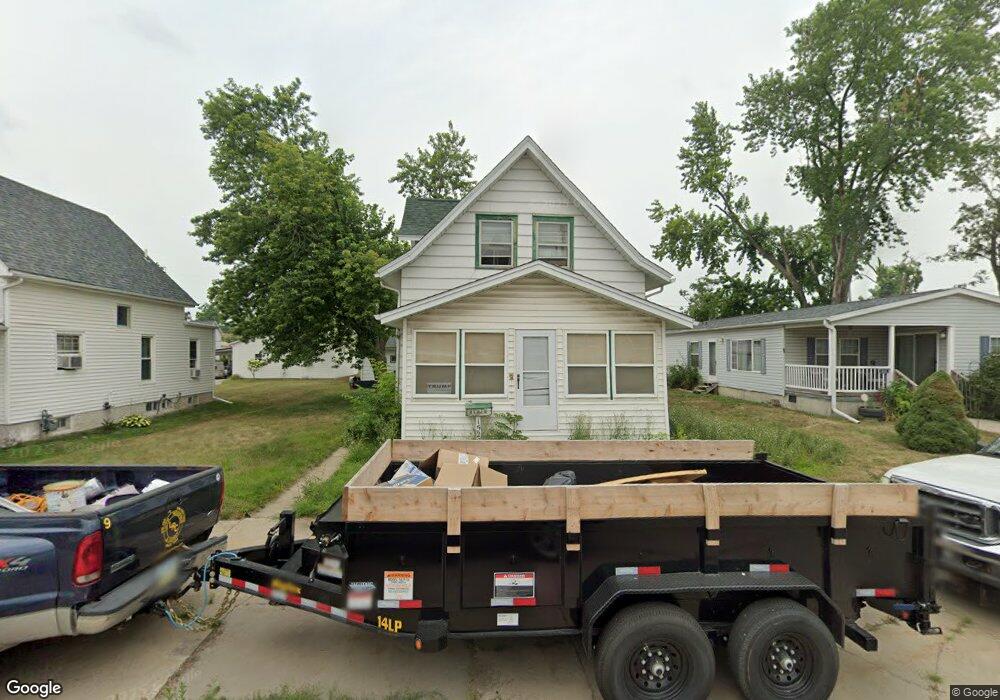
1522 M St SW Cedar Rapids, IA 52404
Taylor NeighborhoodEstimated Value: $94,000 - $121,000
2
Beds
1
Bath
893
Sq Ft
$126/Sq Ft
Est. Value
About This Home
This home is located at 1522 M St SW, Cedar Rapids, IA 52404 and is currently estimated at $112,081, approximately $125 per square foot. 1522 M St SW is a home located in Linn County with nearby schools including Junction City Elementary School, Cedar River Academy at Taylor Elementary School, and Bruce Hall Day Treatment Center.
Ownership History
Date
Name
Owned For
Owner Type
Purchase Details
Closed on
Apr 11, 1998
Sold by
Luth Gene V and Luth Jackie L
Bought by
Luth Gene Raymond
Current Estimated Value
Home Financials for this Owner
Home Financials are based on the most recent Mortgage that was taken out on this home.
Original Mortgage
$48,800
Outstanding Balance
$9,793
Interest Rate
7.75%
Estimated Equity
$102,288
Create a Home Valuation Report for This Property
The Home Valuation Report is an in-depth analysis detailing your home's value as well as a comparison with similar homes in the area
Home Values in the Area
Average Home Value in this Area
Purchase History
| Date | Buyer | Sale Price | Title Company |
|---|---|---|---|
| Luth Gene Raymond | $34,500 | -- |
Source: Public Records
Mortgage History
| Date | Status | Borrower | Loan Amount |
|---|---|---|---|
| Open | Luth Gene Raymond | $48,800 |
Source: Public Records
Tax History Compared to Growth
Tax History
| Year | Tax Paid | Tax Assessment Tax Assessment Total Assessment is a certain percentage of the fair market value that is determined by local assessors to be the total taxable value of land and additions on the property. | Land | Improvement |
|---|---|---|---|---|
| 2025 | $1,504 | $107,000 | $29,800 | $77,200 |
| 2024 | $1,640 | $95,500 | $27,500 | $68,000 |
| 2023 | $1,640 | $95,500 | $27,500 | $68,000 |
| 2022 | $1,516 | $86,600 | $23,000 | $63,600 |
| 2021 | $1,402 | $82,100 | $23,000 | $59,100 |
| 2020 | $1,402 | $72,100 | $20,700 | $51,400 |
| 2019 | $1,332 | $70,300 | $20,700 | $49,600 |
| 2018 | $1,290 | $70,300 | $20,700 | $49,600 |
| 2017 | $1,511 | $63,700 | $20,700 | $43,000 |
| 2016 | $1,511 | $71,100 | $20,700 | $50,400 |
| 2015 | $1,577 | $74,151 | $20,655 | $53,496 |
| 2014 | $1,392 | $76,592 | $20,655 | $55,937 |
| 2013 | $1,410 | $76,592 | $20,655 | $55,937 |
Source: Public Records
Map
Nearby Homes