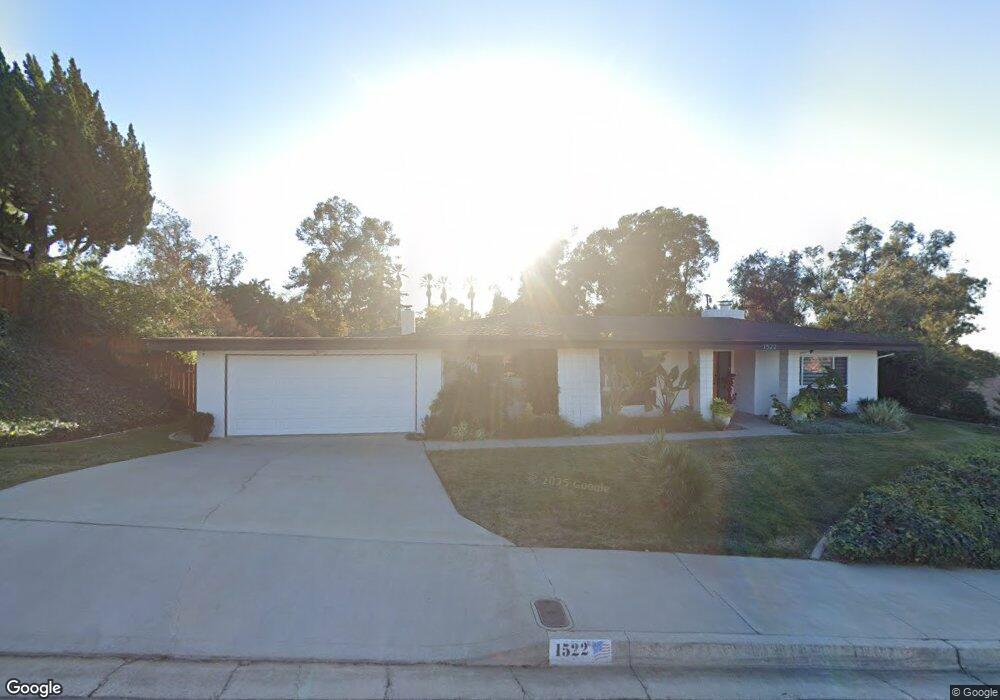
1522 Pamela Crescent Redlands, CA 92373
South Redlands NeighborhoodEstimated Value: $831,000 - $1,010,000
4
Beds
3
Baths
2,557
Sq Ft
$354/Sq Ft
Est. Value
About This Home
This home is located at 1522 Pamela Crescent, Redlands, CA 92373 and is currently estimated at $905,046, approximately $353 per square foot. 1522 Pamela Crescent is a home located in San Bernardino County with nearby schools including Mariposa Elementary School, Moore Middle School, and Redlands East Valley High School.
Ownership History
Date
Name
Owned For
Owner Type
Purchase Details
Closed on
Jan 27, 2021
Sold by
Zimbro Kyle and Zimbro Adrienne
Bought by
Zimbro Kyle P and Zimbro Adrienne L
Current Estimated Value
Purchase Details
Closed on
Feb 21, 2020
Sold by
Waldum Michael C and Waldum Harold P
Bought by
Zimbro Kyle and Zimbro Adrienne
Home Financials for this Owner
Home Financials are based on the most recent Mortgage that was taken out on this home.
Original Mortgage
$492,000
Outstanding Balance
$433,956
Interest Rate
3.4%
Mortgage Type
New Conventional
Estimated Equity
$471,090
Purchase Details
Closed on
Aug 13, 1998
Sold by
Waldum Harold P and Waldum Renata R
Bought by
Waldum Harold F and Waldum Renata R
Purchase Details
Closed on
Mar 5, 1998
Sold by
Waldum Harold P and Waldum Renata R
Bought by
Waldum Harold P and Waldum Renata R
Home Financials for this Owner
Home Financials are based on the most recent Mortgage that was taken out on this home.
Original Mortgage
$52,600
Interest Rate
7.11%
Create a Home Valuation Report for This Property
The Home Valuation Report is an in-depth analysis detailing your home's value as well as a comparison with similar homes in the area
Home Values in the Area
Average Home Value in this Area
Purchase History
| Date | Buyer | Sale Price | Title Company |
|---|---|---|---|
| Zimbro Kyle P | -- | None Available | |
| Zimbro Kyle | $615,000 | Fidelity National Title Co | |
| Waldum Harold F | -- | -- | |
| Waldum Harold P | -- | Orange Coast Title |
Source: Public Records
Mortgage History
| Date | Status | Borrower | Loan Amount |
|---|---|---|---|
| Open | Zimbro Kyle | $492,000 | |
| Previous Owner | Waldum Harold P | $52,600 |
Source: Public Records
Tax History Compared to Growth
Tax History
| Year | Tax Paid | Tax Assessment Tax Assessment Total Assessment is a certain percentage of the fair market value that is determined by local assessors to be the total taxable value of land and additions on the property. | Land | Improvement |
|---|---|---|---|---|
| 2025 | $7,792 | $672,592 | $196,856 | $475,736 |
| 2024 | $7,792 | $659,404 | $192,996 | $466,408 |
| 2023 | $7,783 | $646,475 | $189,212 | $457,263 |
| 2022 | $7,670 | $633,799 | $185,502 | $448,297 |
| 2021 | $7,810 | $621,372 | $181,865 | $439,507 |
| 2020 | $1,295 | $107,463 | $14,575 | $92,888 |
| 2019 | $1,258 | $105,356 | $14,289 | $91,067 |
| 2018 | $1,226 | $103,290 | $14,009 | $89,281 |
| 2017 | $1,214 | $101,264 | $13,734 | $87,530 |
| 2016 | $1,199 | $99,279 | $13,465 | $85,814 |
| 2015 | $1,189 | $97,788 | $13,263 | $84,525 |
| 2014 | $1,166 | $95,872 | $13,003 | $82,869 |
Source: Public Records
Map
Nearby Homes
- 1517 Pamela Crest
- 1435 Patricia Dr
- 446 E Sunset Dr N
- 505 E Sunset Dr N
- 435 Marilyn Ln
- 512 Golden Dr W
- 533 Via Vista Dr
- 1525 Lynne Ct
- 225 Sunset Dr
- 419 Marcia St
- 612 Golden Dr W
- 613 E Sunset Dr N
- 608 Via Vista Dr
- 620 E Sunset Dr N
- 0 Garden St Unit EV23054640
- 375 Franklin Ave
- 507 E Mariposa Dr
- 1705 Rossmont Dr
- 0 Ford St
- 1627 Halsey St
- 1522 Pamela Crest
- 1526 Pamela Crescent
- 1518 Pamela Crescent
- 1530 Pamela Crescent
- 1521 Pamela Crescent
- 409 E Sunset Dr N
- 1525 Pamela Crescent
- 1514 Pamela Crescent
- 1534 Pamela Crescent
- 1517 Pamela Crescent
- 1529 Pamela Crescent
- 1510 Pamela Crescent
- 0 Juanita Ln
- 1533 Pamela Crest
- 1538 Pamela Crescent
- 1533 Pamela Crescent
- 1513 Pamela Crescent
- 420 E Sunset Dr N
- 428 E Sunset Dr N
- 1509 Pamela Crescent