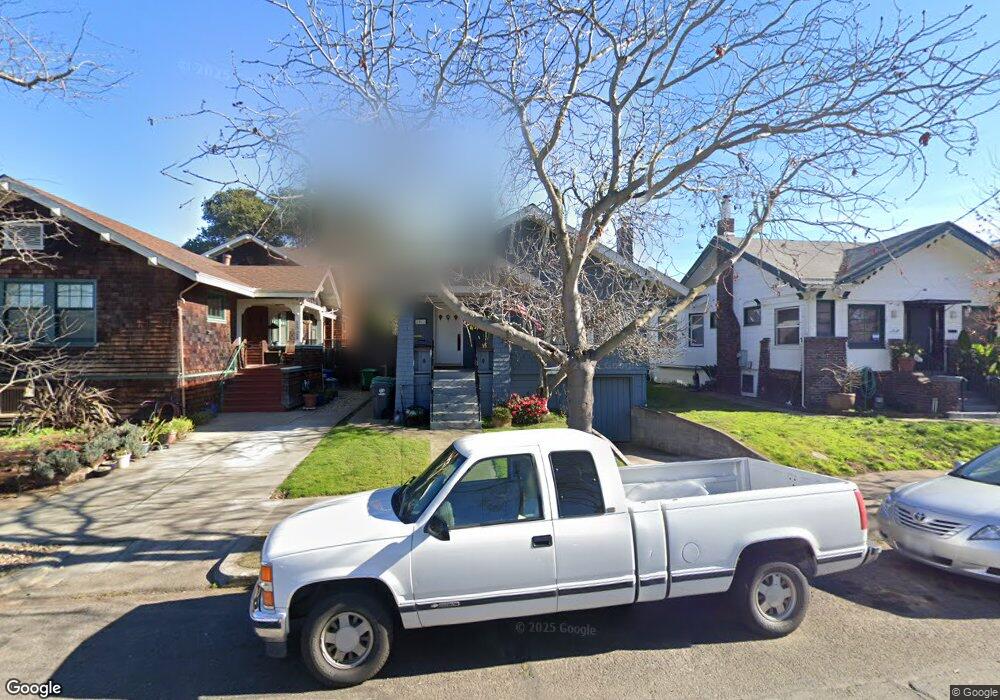
1522 Paru St Alameda, CA 94501
West Alameda NeighborhoodEstimated Value: $994,268 - $1,241,000
2
Beds
1
Bath
1,385
Sq Ft
$785/Sq Ft
Est. Value
About This Home
This home is located at 1522 Paru St, Alameda, CA 94501 and is currently estimated at $1,087,567, approximately $785 per square foot. 1522 Paru St is a home located in Alameda County with nearby schools including Maya Lin School, Will C. Wood Middle School, and Encinal Junior/Senior High.
Ownership History
Date
Name
Owned For
Owner Type
Purchase Details
Closed on
Feb 29, 2016
Sold by
Chere Francis J and Lipsey Patricia
Bought by
Chere Francis J and Lipsey Patricia
Current Estimated Value
Purchase Details
Closed on
Oct 29, 2015
Sold by
Chere Francis J and Chere Francis J
Bought by
Chere Francis J and Lipsey Patrica
Purchase Details
Closed on
Aug 10, 2011
Sold by
Chere Francis J and Chere Francis Joseph
Bought by
Chere Francis J
Home Financials for this Owner
Home Financials are based on the most recent Mortgage that was taken out on this home.
Original Mortgage
$406,000
Interest Rate
4.46%
Mortgage Type
New Conventional
Purchase Details
Closed on
Aug 17, 2009
Sold by
Fuller M Robin
Bought by
Chere Francis J and Chere Francis Joseph
Home Financials for this Owner
Home Financials are based on the most recent Mortgage that was taken out on this home.
Original Mortgage
$417,000
Interest Rate
5.09%
Mortgage Type
New Conventional
Create a Home Valuation Report for This Property
The Home Valuation Report is an in-depth analysis detailing your home's value as well as a comparison with similar homes in the area
Home Values in the Area
Average Home Value in this Area
Purchase History
| Date | Buyer | Sale Price | Title Company |
|---|---|---|---|
| Chere Francis J | -- | None Available | |
| Chere Francis J | -- | None Available | |
| Chere Francis J | -- | Fidelity National Title Co | |
| Chere Francis J | -- | Fidelity National Title Co |
Source: Public Records
Mortgage History
| Date | Status | Borrower | Loan Amount |
|---|---|---|---|
| Closed | Chere Francis J | $406,000 | |
| Closed | Chere Francis J | $417,000 |
Source: Public Records
Tax History Compared to Growth
Tax History
| Year | Tax Paid | Tax Assessment Tax Assessment Total Assessment is a certain percentage of the fair market value that is determined by local assessors to be the total taxable value of land and additions on the property. | Land | Improvement |
|---|---|---|---|---|
| 2025 | $4,572 | $276,836 | $221,682 | $62,154 |
| 2024 | $4,572 | $271,271 | $217,336 | $60,935 |
| 2023 | $4,393 | $272,815 | $213,075 | $59,740 |
| 2022 | $4,283 | $260,467 | $208,898 | $58,569 |
| 2021 | $4,173 | $255,223 | $204,802 | $57,421 |
| 2020 | $4,481 | $259,534 | $202,702 | $56,832 |
| 2019 | $4,009 | $254,446 | $198,728 | $55,718 |
| 2018 | $3,905 | $249,459 | $194,833 | $54,626 |
| 2017 | $3,736 | $244,568 | $191,013 | $53,555 |
| 2016 | $3,720 | $239,773 | $187,268 | $52,505 |
| 2015 | $3,698 | $236,172 | $184,456 | $51,716 |
| 2014 | $3,937 | $231,546 | $180,843 | $50,703 |
Source: Public Records
Map
Nearby Homes
- 1572 Lincoln Ave
- 1707 Lincoln Ave
- 1428 Paru St
- 1701 Central Ave Unit P
- 1613 Union St
- 1613 Stanton St
- 1523 Lincoln Ave
- 1711 Arbor St
- 1661 Ave
- 1665 Ellen Craig Ave
- 1662 Larkspur St
- 1670 Larkspur St
- 1933 Grand St
- 1937 Grand St
- 1660 Clement Ave
- 610 Grand St
- 1815 Balsa St
- Residence 4 Plan at Skyline
- Residence 1 Plan at Skyline
- Residence 3 Plan at Skyline