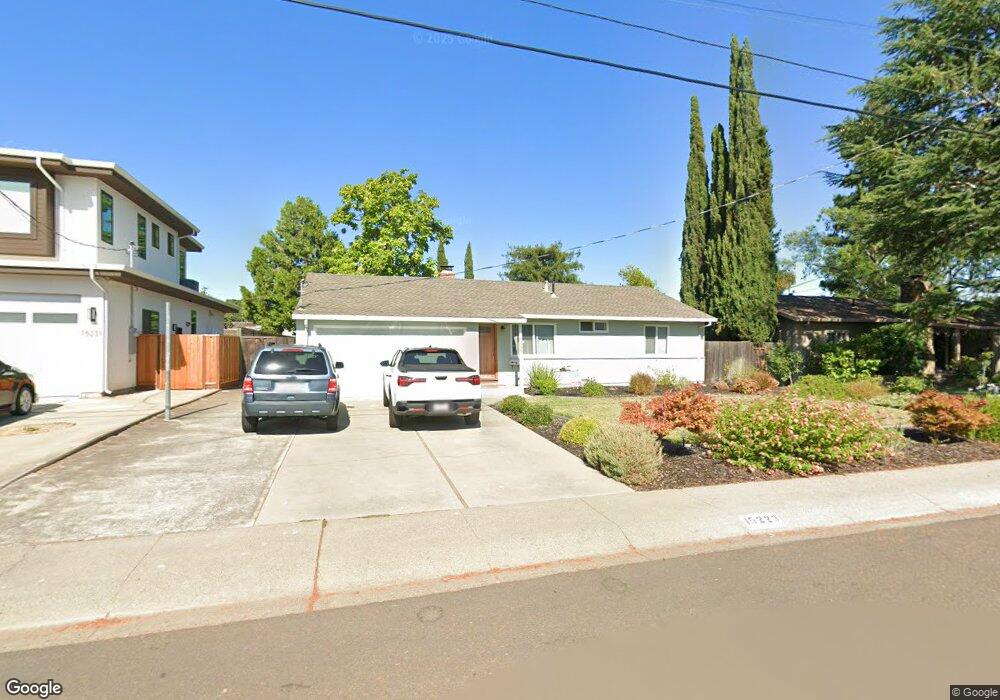
15223 Cooper Ave San Jose, CA 95124
Blossom Crest NeighborhoodEstimated Value: $1,854,000 - $2,129,000
3
Beds
1
Bath
1,053
Sq Ft
$1,885/Sq Ft
Est. Value
About This Home
This home is located at 15223 Cooper Ave, San Jose, CA 95124 and is currently estimated at $1,985,177, approximately $1,885 per square foot. 15223 Cooper Ave is a home located in Santa Clara County with nearby schools including Carlton Elementary School, Union Middle School, and Leigh High School.
Ownership History
Date
Name
Owned For
Owner Type
Purchase Details
Closed on
Dec 26, 2020
Sold by
Gaudet Alan J and Gaudet Sheila C
Bought by
Gaudet Alan J and The Gaudet Family Trust
Current Estimated Value
Home Financials for this Owner
Home Financials are based on the most recent Mortgage that was taken out on this home.
Original Mortgage
$303,000
Interest Rate
2.7%
Mortgage Type
New Conventional
Purchase Details
Closed on
Jan 21, 2020
Sold by
Gaudet Alan J and Gaudet Sheila Catherine
Bought by
Gaudet Alan Mj and Gaudet Sheila C
Purchase Details
Closed on
Feb 21, 2017
Sold by
Gaudet Sheila Catherine and Gaudet Alan J
Bought by
Gaudet Alan J and Gaudet Sheila Catherine
Home Financials for this Owner
Home Financials are based on the most recent Mortgage that was taken out on this home.
Original Mortgage
$320,000
Interest Rate
4.15%
Mortgage Type
New Conventional
Purchase Details
Closed on
Apr 29, 1999
Sold by
Gardner Scott L and Karen Regan Gardner
Bought by
Gardner Scott L and Regan Gardner Karen A
Create a Home Valuation Report for This Property
The Home Valuation Report is an in-depth analysis detailing your home's value as well as a comparison with similar homes in the area
Home Values in the Area
Average Home Value in this Area
Purchase History
| Date | Buyer | Sale Price | Title Company |
|---|---|---|---|
| Gaudet Alan J | -- | Fidelity National Title Co | |
| Gaudet Alan J | -- | Fidelity National Title Co | |
| Gaudet Alan Mj | -- | None Available | |
| Gaudet Alan J | $160,000 | Old Republic Title Company | |
| Gardner Scott L | -- | -- |
Source: Public Records
Mortgage History
| Date | Status | Borrower | Loan Amount |
|---|---|---|---|
| Closed | Gaudet Alan J | $303,000 | |
| Closed | Gaudet Alan J | $320,000 |
Source: Public Records
Tax History Compared to Growth
Tax History
| Year | Tax Paid | Tax Assessment Tax Assessment Total Assessment is a certain percentage of the fair market value that is determined by local assessors to be the total taxable value of land and additions on the property. | Land | Improvement |
|---|---|---|---|---|
| 2025 | $11,270 | $786,726 | $601,198 | $185,528 |
| 2024 | $11,270 | $771,301 | $589,410 | $181,891 |
| 2023 | $11,030 | $756,178 | $577,853 | $178,325 |
| 2022 | $10,808 | $741,352 | $566,523 | $174,829 |
| 2021 | $10,581 | $726,816 | $555,415 | $171,401 |
| 2020 | $10,350 | $719,364 | $549,720 | $169,644 |
| 2019 | $10,162 | $705,260 | $538,942 | $166,318 |
| 2018 | $9,909 | $691,432 | $528,375 | $163,057 |
| 2017 | $4,027 | $215,442 | $85,921 | $129,521 |
| 2016 | $3,843 | $211,219 | $84,237 | $126,982 |
| 2015 | $3,778 | $208,047 | $82,972 | $125,075 |
| 2014 | $3,323 | $203,972 | $81,347 | $122,625 |
Source: Public Records
Map
Nearby Homes
- 15236 Dickens Ave
- 2291 Samaritan Dr Unit 3
- 4787 Hatfield Walkway Unit 4
- 4768 Hatfield Walk Unit 2
- 2303 Saidel Dr Unit 4
- 2309 Saidel Dr Unit 2
- 200 Westchester Dr
- 5222 Adalina Ct
- 15560 Camino Del Cerro
- 4593 Fallstone Ct
- 2026 Lynn Ave
- 102 Hildebrand Dr
- 1957 Wilfred Way
- 129 Dover St
- 15560 Blossom Hill Rd
- 14802 Cole Dr
- 4867 Anna Dr
- 4848 Anna Dr
- 16100 Jasmine Way
- 3949 Starview Dr
- 15215 Cooper Ave
- 15231 Cooper Ave
- 15240 Charlotte Ave
- 15207 Cooper Ave
- 15239 Cooper Ave
- 15252 Charlotte Ave
- 15228 Charlotte Ave
- 15264 Charlotte Ave
- 15222 Cooper Ave
- 15216 Charlotte Ave
- 15216 Cooper Ave
- 15230 Cooper Ave
- 15199 Cooper Ave
- 15247 Cooper Ave
- 15238 Cooper Ave
- 15206 Cooper Ave
- 15276 Charlotte Ave
- 15204 Charlotte Ave
- 15193 Cooper Ave
- 15198 Cooper Ave