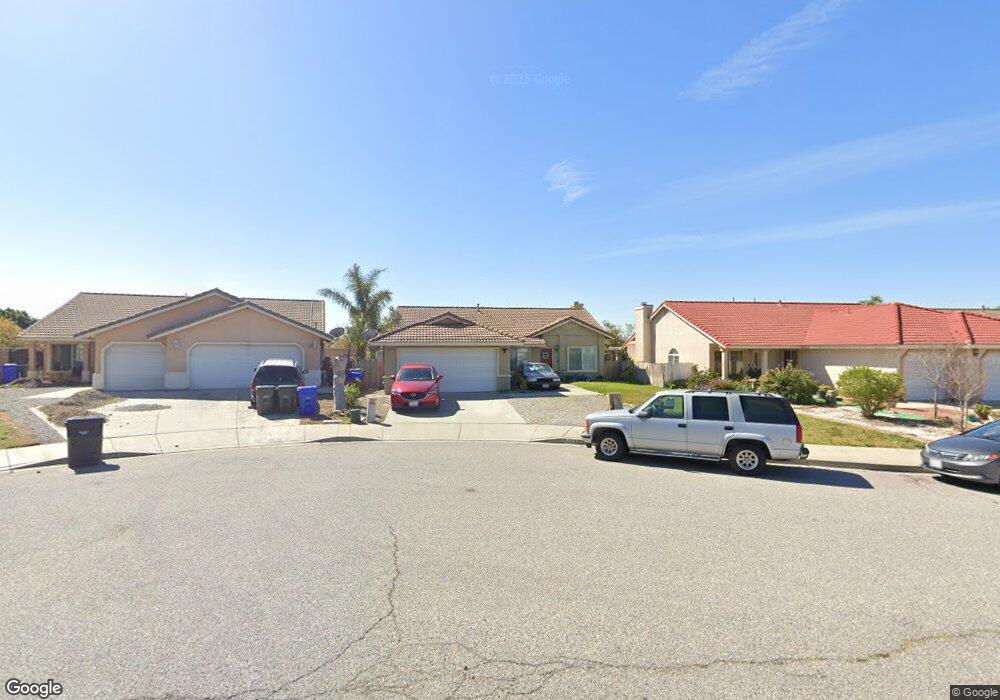
15223 Macadamia Ct Fontana, CA 92335
Estimated Value: $578,000 - $694,000
4
Beds
2
Baths
1,706
Sq Ft
$366/Sq Ft
Est. Value
About This Home
This home is located at 15223 Macadamia Ct, Fontana, CA 92335 and is currently estimated at $623,606, approximately $365 per square foot. 15223 Macadamia Ct is a home located in San Bernardino County with nearby schools including Redwood Elementary School, Almeria Middle School, and Summit High School.
Ownership History
Date
Name
Owned For
Owner Type
Purchase Details
Closed on
Jan 19, 2011
Sold by
Lott Clarence
Bought by
Crutcher La Vonna
Current Estimated Value
Purchase Details
Closed on
Jan 31, 2008
Sold by
Crutcher La Vonna
Bought by
Crutcher Lavonna and Lott La Kisha
Purchase Details
Closed on
Nov 18, 2005
Sold by
Crutcher La Vonna
Bought by
Crutcher La Vonna and Lott La Kisha
Home Financials for this Owner
Home Financials are based on the most recent Mortgage that was taken out on this home.
Original Mortgage
$272,000
Interest Rate
6.5%
Mortgage Type
Stand Alone First
Purchase Details
Closed on
Oct 21, 2002
Sold by
25 Parkside Homes Lp
Bought by
Lott La Vonna and Lott La Kisha
Home Financials for this Owner
Home Financials are based on the most recent Mortgage that was taken out on this home.
Original Mortgage
$144,300
Interest Rate
5.95%
Create a Home Valuation Report for This Property
The Home Valuation Report is an in-depth analysis detailing your home's value as well as a comparison with similar homes in the area
Purchase History
| Date | Buyer | Sale Price | Title Company |
|---|---|---|---|
| Crutcher La Vonna | -- | None Available | |
| Crutcher Lavonna | -- | Lenders Choice Title Company | |
| Crutcher La Vonna | -- | Orange Coast Title | |
| Lott La Vonna | $180,500 | Orange Coast Title |
Source: Public Records
Mortgage History
| Date | Status | Borrower | Loan Amount |
|---|---|---|---|
| Previous Owner | Crutcher La Vonna | $272,000 | |
| Previous Owner | Lott La Vonna | $144,300 |
Source: Public Records
Tax History
| Year | Tax Paid | Tax Assessment Tax Assessment Total Assessment is a certain percentage of the fair market value that is determined by local assessors to be the total taxable value of land and additions on the property. | Land | Improvement |
|---|---|---|---|---|
| 2025 | $3,735 | $260,701 | $65,175 | $195,526 |
| 2024 | $3,536 | $255,589 | $63,897 | $191,692 |
| 2023 | $3,467 | $250,577 | $62,644 | $187,933 |
| 2022 | $3,455 | $245,664 | $61,416 | $184,248 |
| 2021 | $3,421 | $240,847 | $60,212 | $180,635 |
| 2020 | $3,415 | $238,378 | $59,595 | $178,783 |
| 2019 | $3,337 | $233,703 | $58,426 | $175,277 |
| 2018 | $3,372 | $229,120 | $57,280 | $171,840 |
| 2017 | $3,357 | $224,628 | $56,157 | $168,471 |
| 2016 | $3,314 | $220,224 | $55,056 | $165,168 |
| 2015 | $3,282 | $216,916 | $54,229 | $162,687 |
| 2014 | $3,277 | $212,667 | $53,167 | $159,500 |
Source: Public Records
Map
Nearby Homes
- 15507 Vanilla Bean Ln
- 14828 Ivy Ave
- 15609 Paprika Ln
- 7786 Arosia Dr
- 0 Foothill Blvd Unit CV25217423
- 15797 Foothill Blvd
- 15440 Ramona Ave
- 7652 Plumaria Dr
- 8316 Reseda Ave
- 14932 Dandelion Ct
- 15465 Raymond Ave
- 15359 Palm Leaf Ln
- 7667 Yellow Iris Ct
- 7908 Tokay Ave Unit 107
- 14412 Bing Ave
- 8972 Carob Dr
- 14414 Bing Ave
- 7526 Purple Sage Cir
- 14958 Granada Ave
- 7441 Sultana Ave
- 15215 Macadamia Ct
- 15235 Macadamia Ct
- 15203 Macadamia Ct
- 15243 Macadamia Ct
- 15248 Macadamia Ct
- 15195 Macadamia Ct
- 15224 Macadamia Ct
- 15212 Macadamia Ct
- 15232 Macadamia Ct
- 15244 Macadamia Ct
- 15204 Macadamia Ct
- 15183 Macadamia Ct
- 8228 Beech Ave
- 15192 Macadamia Ct
- 15175 Macadamia Ct
- 15184 Macadamia Ct
- 8208 Beech Ave
- 8184 Beech Ave
- 8244 Beech Ave Unit 4
- 8244 Beech Ave Unit 2
Your Personal Tour Guide
Ask me questions while you tour the home.