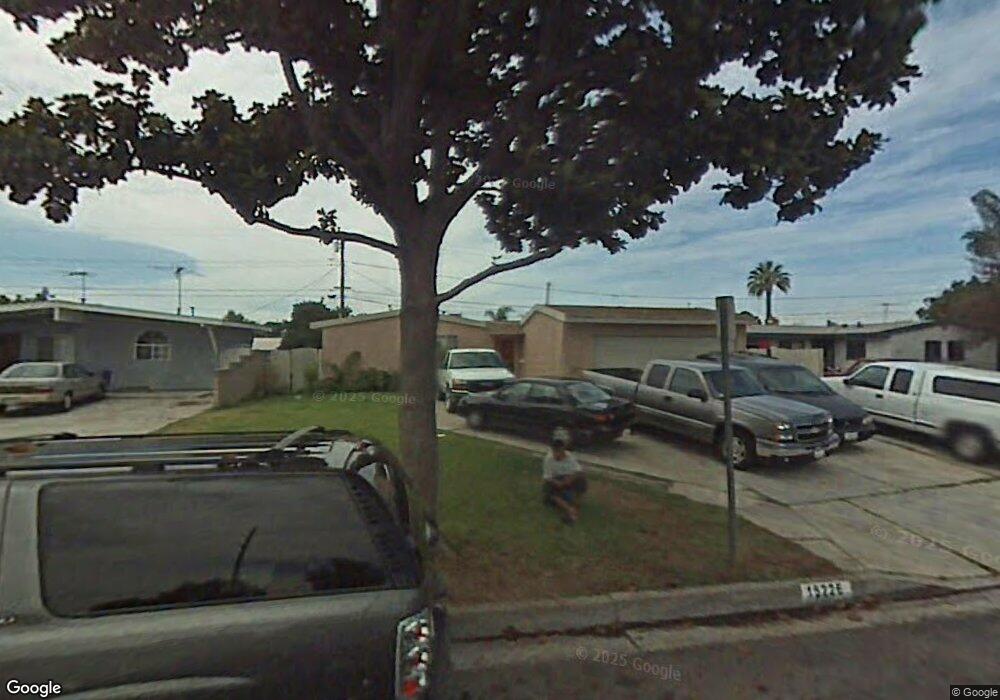
15226 Temple Ave La Puente, CA 91744
Estimated Value: $729,000 - $804,000
3
Beds
2
Baths
1,518
Sq Ft
$498/Sq Ft
Est. Value
About This Home
This home is located at 15226 Temple Ave, La Puente, CA 91744 and is currently estimated at $755,874, approximately $497 per square foot. 15226 Temple Ave is a home located in Los Angeles County with nearby schools including Sparks Elementary School, Sparks Middle School, and La Puente High School.
Ownership History
Date
Name
Owned For
Owner Type
Purchase Details
Closed on
May 12, 2011
Sold by
Hsbc Bank Usa National Association
Bought by
Lu Ding Ding
Current Estimated Value
Purchase Details
Closed on
Jan 20, 2011
Sold by
Ulloa Ana V and Vega Catarino
Bought by
Hsbc Bank Usa National Association
Purchase Details
Closed on
Feb 17, 2006
Sold by
Melendez Ruben and Melendez Leonor
Bought by
Vega Catarino and Ulloa Ana V
Home Financials for this Owner
Home Financials are based on the most recent Mortgage that was taken out on this home.
Original Mortgage
$396,000
Interest Rate
6.75%
Mortgage Type
Purchase Money Mortgage
Purchase Details
Closed on
Jul 24, 2003
Sold by
Jacquez Avelino S and Jacquez Saddie M
Bought by
Melendez Ruben and Melendez Leonor
Home Financials for this Owner
Home Financials are based on the most recent Mortgage that was taken out on this home.
Original Mortgage
$228,000
Interest Rate
6.25%
Mortgage Type
Purchase Money Mortgage
Create a Home Valuation Report for This Property
The Home Valuation Report is an in-depth analysis detailing your home's value as well as a comparison with similar homes in the area
Home Values in the Area
Average Home Value in this Area
Purchase History
| Date | Buyer | Sale Price | Title Company |
|---|---|---|---|
| Lu Ding Ding | $208,000 | Stewart Title | |
| Hsbc Bank Usa National Association | $191,250 | None Available | |
| Vega Catarino | $505,000 | Southland Title | |
| Melendez Ruben | $285,000 | First American Title Co |
Source: Public Records
Mortgage History
| Date | Status | Borrower | Loan Amount |
|---|---|---|---|
| Previous Owner | Vega Catarino | $396,000 | |
| Previous Owner | Melendez Ruben | $228,000 | |
| Closed | Melendez Ruben | $57,000 |
Source: Public Records
Tax History Compared to Growth
Tax History
| Year | Tax Paid | Tax Assessment Tax Assessment Total Assessment is a certain percentage of the fair market value that is determined by local assessors to be the total taxable value of land and additions on the property. | Land | Improvement |
|---|---|---|---|---|
| 2025 | $3,654 | $266,469 | $193,578 | $72,891 |
| 2024 | $3,654 | $261,245 | $189,783 | $71,462 |
| 2023 | $3,566 | $256,123 | $186,062 | $70,061 |
| 2022 | $3,468 | $251,102 | $182,414 | $68,688 |
| 2021 | $3,403 | $246,180 | $178,838 | $67,342 |
| 2019 | $3,311 | $238,881 | $173,535 | $65,346 |
| 2018 | $3,157 | $234,198 | $170,133 | $64,065 |
| 2016 | $2,928 | $225,106 | $163,528 | $61,578 |
| 2015 | $2,876 | $221,726 | $161,072 | $60,654 |
| 2014 | $2,836 | $217,383 | $157,917 | $59,466 |
Source: Public Records
Map
Nearby Homes
- 15246 Temple Ave
- 15416 Giordano St
- 357 Cadbrook Dr
- 14940 Beckner St
- 14972 Giordano St
- 829 Foxworth Ave
- 750 Glenshaw Dr
- 822 Greenberry Dr
- 15732 Victoria Ave
- 545 N 5th St
- 15625 Loukelton St
- 15879 Hill St
- 14612 Hutchcroft St
- 15900 Rowland St
- 826 Del Valle Ave
- 665 Larimore Ave
- 932 Shadydale Ave
- 1084 Del Valle Ave
- 1329 N Stimson Ave
- 736 Tonopah Ave
- 15220 Temple Ave
- 15234 Temple Ave
- 15223 Hartsville St
- 15217 Hartsville St
- 15229 Hartsville St
- 15240 Temple Ave
- 15214 Temple Ave
- 15209 Hartsville St
- 15210 Temple Ave
- 15241 Hartsville St
- 15203 Hartsville St
- 15222 Hartsville St
- 15214 Hartsville St
- 15217 Temple Ave
- 15228 Hartsville St
- 15252 Temple Ave
- 551 N Nantes Ave
- 15234 Hartsville St
- 15208 Hartsville St
- 15235 Temple Ave