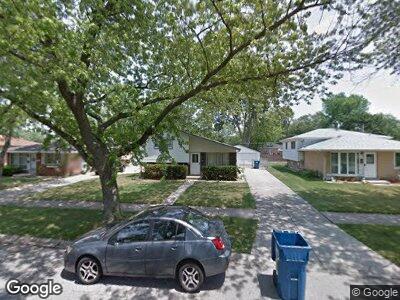
15229 Lawndale Ave Midlothian, IL 60445
Estimated Value: $217,000 - $251,000
3
Beds
2
Baths
1,063
Sq Ft
$223/Sq Ft
Est. Value
About This Home
This home is located at 15229 Lawndale Ave, Midlothian, IL 60445 and is currently estimated at $237,297, approximately $223 per square foot. 15229 Lawndale Ave is a home located in Cook County with nearby schools including Central Park Elementary School, Bremen High School, and St. Christopher School.
Ownership History
Date
Name
Owned For
Owner Type
Purchase Details
Closed on
Mar 5, 2008
Sold by
Us Bank Na
Bought by
Abromaitis Christopher
Current Estimated Value
Home Financials for this Owner
Home Financials are based on the most recent Mortgage that was taken out on this home.
Original Mortgage
$124,000
Interest Rate
5.79%
Mortgage Type
Unknown
Purchase Details
Closed on
Aug 27, 2007
Sold by
Suarez Guillermo
Bought by
Us Bank Na and Mastr Asset Backed Securities Trust 2006
Purchase Details
Closed on
Feb 23, 2006
Sold by
Luque Mary
Bought by
Suarez Guillermo
Home Financials for this Owner
Home Financials are based on the most recent Mortgage that was taken out on this home.
Original Mortgage
$157,600
Interest Rate
7.99%
Mortgage Type
Balloon
Create a Home Valuation Report for This Property
The Home Valuation Report is an in-depth analysis detailing your home's value as well as a comparison with similar homes in the area
Home Values in the Area
Average Home Value in this Area
Purchase History
| Date | Buyer | Sale Price | Title Company |
|---|---|---|---|
| Abromaitis Christopher | $155,000 | First American Title | |
| Us Bank Na | -- | None Available | |
| Suarez Guillermo | $197,000 | Chicago Title Insurance Co |
Source: Public Records
Mortgage History
| Date | Status | Borrower | Loan Amount |
|---|---|---|---|
| Open | Abromaitis Christopher J | $112,500 | |
| Closed | Abromaitis Christopher | $117,465 | |
| Closed | Abromaitis Christopher | $124,000 | |
| Previous Owner | Suarez Guillermo | $157,600 | |
| Previous Owner | Suarez Guillermo | $39,400 | |
| Previous Owner | Rickard Betty L | $33,989 |
Source: Public Records
Tax History Compared to Growth
Tax History
| Year | Tax Paid | Tax Assessment Tax Assessment Total Assessment is a certain percentage of the fair market value that is determined by local assessors to be the total taxable value of land and additions on the property. | Land | Improvement |
|---|---|---|---|---|
| 2024 | $5,400 | $18,000 | $3,098 | $14,902 |
| 2023 | $5,400 | $18,000 | $3,098 | $14,902 |
| 2022 | $5,400 | $14,916 | $2,734 | $12,182 |
| 2021 | $5,232 | $14,914 | $2,733 | $12,181 |
| 2020 | $5,081 | $14,914 | $2,733 | $12,181 |
| 2019 | $4,547 | $13,898 | $2,551 | $11,347 |
| 2018 | $4,472 | $13,898 | $2,551 | $11,347 |
| 2017 | $4,335 | $13,898 | $2,551 | $11,347 |
| 2016 | $4,173 | $12,223 | $2,187 | $10,036 |
| 2015 | $4,027 | $12,223 | $2,187 | $10,036 |
| 2014 | $3,930 | $12,223 | $2,187 | $10,036 |
| 2013 | $4,089 | $13,808 | $2,187 | $11,621 |
Source: Public Records
Map
Nearby Homes
- 15241 Millard Ave
- 15303 Birch Rd
- 3519 Roesner Dr
- 15330 Cherry Ln
- 3719 152nd St
- 15323 Cherry Ln
- 3612 151st St
- 15100 Hamlin Ave
- 15100 Avers Ave
- 15412 Hamlin Ave
- 3914 153rd St
- 3310 Heather Dr
- 14922 Lawndale Ave
- 15320 Harding Ave
- 3236 Roesner Dr
- 15318 Cypress Rd
- 3469 W 155th St
- 14905 Springfield Ave
- 14959 Willowcrest Ct Unit 15
- 14828 Saint Louis Ave
- 15229 Lawndale Ave
- 15227 Lawndale Ave
- 15231 Lawndale Ave
- 15225 Lawndale Ave
- 15235 Lawndale Ave
- 15226 Millard Ave
- 15228 Millard Ave
- 15224 Millard Ave
- 15223 Lawndale Ave
- 15222 Millard Ave
- 15230 Millard Ave
- 15237 Lawndale Ave
- 15230 Lawndale Ave
- 15228 Lawndale Ave
- 15232 Lawndale Ave
- 15221 Lawndale Ave
- 15226 Lawndale Ave
- 15236 Lawndale Ave
- 15241 Lawndale Ave
- 15224 Lawndale Ave