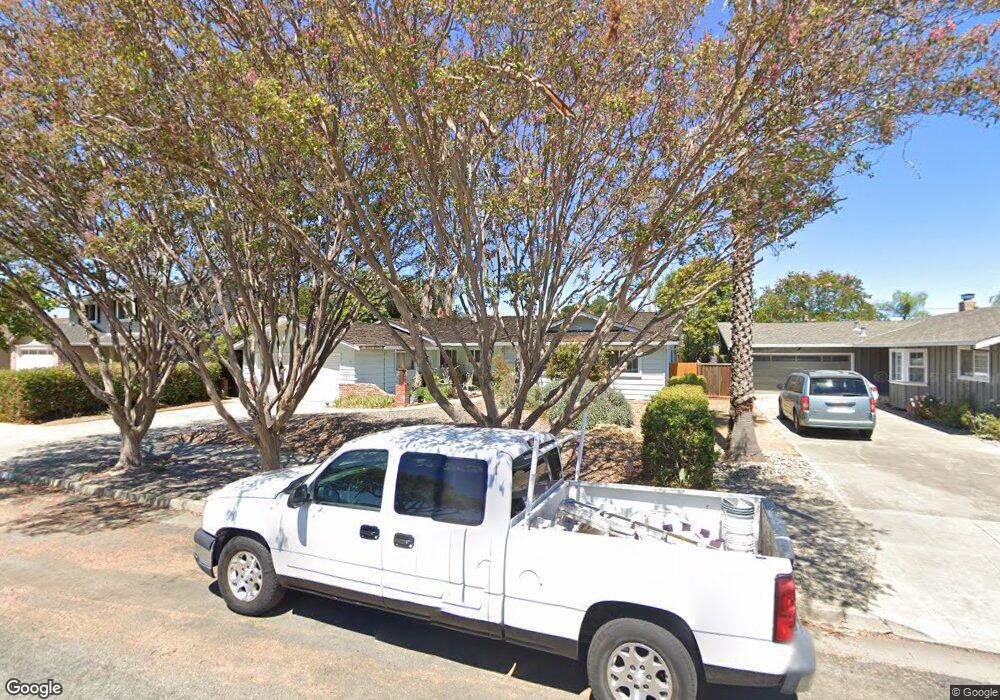
1523 Altamont Ave San Jose, CA 95125
Willow Glen South-Lincoln Glen NeighborhoodEstimated Value: $2,153,000 - $2,234,575
4
Beds
3
Baths
2,066
Sq Ft
$1,060/Sq Ft
Est. Value
About This Home
This home is located at 1523 Altamont Ave, San Jose, CA 95125 and is currently estimated at $2,189,644, approximately $1,059 per square foot. 1523 Altamont Ave is a home located in Santa Clara County with nearby schools including Schallenberger Elementary School, Willow Glen Middle, and Willow Glen High School.
Ownership History
Date
Name
Owned For
Owner Type
Purchase Details
Closed on
Mar 27, 2021
Sold by
Henhington Daian and Hazard Malyne
Bought by
Hazard Malyne M
Current Estimated Value
Home Financials for this Owner
Home Financials are based on the most recent Mortgage that was taken out on this home.
Original Mortgage
$300,000
Outstanding Balance
$269,985
Interest Rate
2.8%
Mortgage Type
New Conventional
Estimated Equity
$1,919,659
Purchase Details
Closed on
Nov 4, 2020
Sold by
Hazard Alyne and Estate Of Benjamin Harrison Ha
Bought by
Hennington Daian and Hazard Malyne
Purchase Details
Closed on
Aug 8, 1996
Sold by
Hazard Chieko
Bought by
Hazard Benjamin H
Home Financials for this Owner
Home Financials are based on the most recent Mortgage that was taken out on this home.
Original Mortgage
$165,000
Interest Rate
8.18%
Create a Home Valuation Report for This Property
The Home Valuation Report is an in-depth analysis detailing your home's value as well as a comparison with similar homes in the area
Home Values in the Area
Average Home Value in this Area
Purchase History
| Date | Buyer | Sale Price | Title Company |
|---|---|---|---|
| Hazard Malyne M | $225,000 | Consumers Title Company | |
| Hazard Alyne | -- | Consumers Title Company | |
| Hennington Dalan | -- | Consumers Title Company | |
| Hennington Daian | -- | Johnson Karen | |
| Hazard Benjamin H | -- | Fidelity National Title Co |
Source: Public Records
Mortgage History
| Date | Status | Borrower | Loan Amount |
|---|---|---|---|
| Open | Hazard Malyne M | $300,000 | |
| Previous Owner | Hazard Benjamin H | $165,000 |
Source: Public Records
Tax History Compared to Growth
Tax History
| Year | Tax Paid | Tax Assessment Tax Assessment Total Assessment is a certain percentage of the fair market value that is determined by local assessors to be the total taxable value of land and additions on the property. | Land | Improvement |
|---|---|---|---|---|
| 2025 | $18,381 | $1,492,857 | $1,226,909 | $265,948 |
| 2024 | $18,381 | $1,463,586 | $1,202,852 | $260,734 |
| 2023 | $18,057 | $1,434,889 | $1,179,267 | $255,622 |
| 2022 | $17,903 | $1,406,755 | $1,156,145 | $250,610 |
| 2021 | $2,772 | $116,704 | $33,912 | $82,792 |
| 2020 | $2,664 | $115,509 | $33,565 | $81,944 |
| 2019 | $2,501 | $113,245 | $32,907 | $80,338 |
| 2018 | $2,453 | $111,025 | $32,262 | $78,763 |
| 2017 | $2,417 | $108,849 | $31,630 | $77,219 |
| 2016 | $2,280 | $106,715 | $31,010 | $75,705 |
| 2015 | $2,248 | $105,113 | $30,545 | $74,568 |
| 2014 | $1,832 | $103,055 | $29,947 | $73,108 |
Source: Public Records
Map
Nearby Homes
- 1514 San Joaquin Ave
- 1566 Larkspur Dr
- 1632 Trona Way
- 1629 Glenfield Dr
- 1523 Shaw Dr
- 1648 Knollwood Ave
- 1627 Foxworthy Ave
- 3104 Cherry Ave
- 1650 Fairorchard Ave
- 1415 Koch Ln
- 3118 Jenkins Ave
- 1528 Willowdale Dr
- 3215 Jenkins Ave
- 1665 Fairorchard Ave
- 2881 Meridian Ave Unit 224
- 2881 Meridian Ave Unit 264
- 1566 Willowgate Dr
- 1701 Foxworthy Ave
- 2425 Briarwood Dr
- 1267 Hillsdale Ave
- 1525 Altamont Ave
- 1521 Altamont Ave
- 1542 Alisal Ave
- 1527 Altamont Ave
- 1540 Alisal Ave
- 1519 Altamont Ave
- 1544 Alisal Ave
- 1548 Alisal Ave
- 1522 Altamont Ave
- 1529 Altamont Ave
- 1524 Altamont Ave
- 1520 Altamont Ave
- 1517 Altamont Ave
- 1526 Altamont Ave
- 1550 Alisal Ave
- 1536 Alisal Ave
- 1518 Altamont Ave
- 1531 Altamont Ave
- 1528 Altamont Ave
- 1515 Altamont Ave