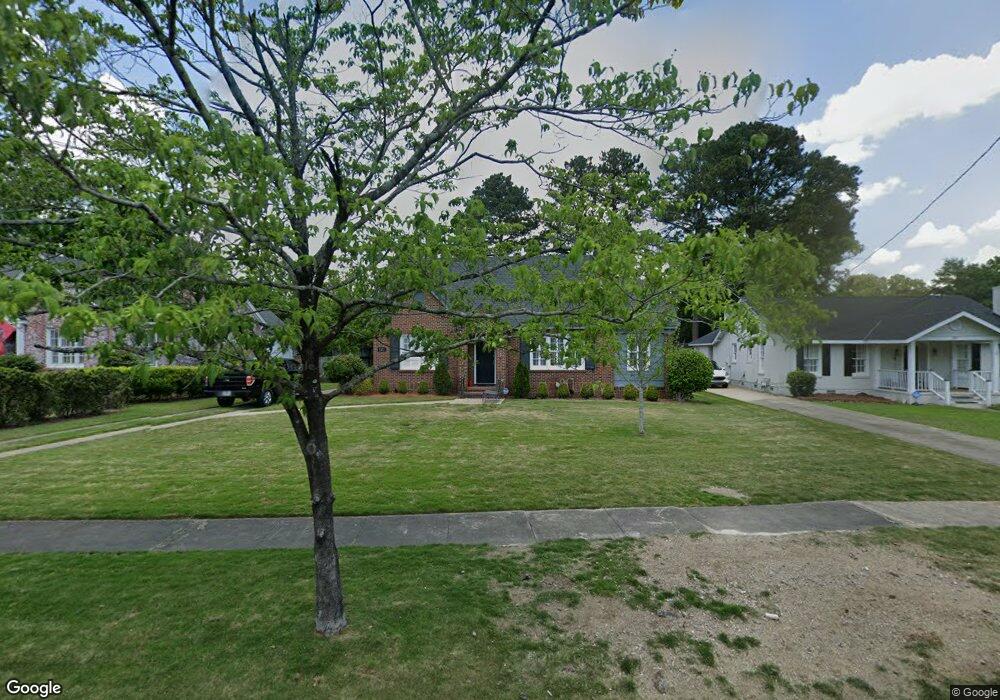
1523 Crest Dr Columbus, GA 31906
Wynns Hill NeighborhoodEstimated Value: $277,000 - $328,000
3
Beds
3
Baths
1,911
Sq Ft
$156/Sq Ft
Est. Value
About This Home
This home is located at 1523 Crest Dr, Columbus, GA 31906 and is currently estimated at $297,867, approximately $155 per square foot. 1523 Crest Dr is a home located in Muscogee County with nearby schools including Baker Middle School, Jordan Vocational High School, and Wynnton Elementary School.
Ownership History
Date
Name
Owned For
Owner Type
Purchase Details
Closed on
Mar 12, 2018
Sold by
Jones Brock
Bought by
Tisdale Philop D and Tisdale Winnie L
Current Estimated Value
Home Financials for this Owner
Home Financials are based on the most recent Mortgage that was taken out on this home.
Original Mortgage
$169,653
Outstanding Balance
$145,172
Interest Rate
4.32%
Mortgage Type
New Conventional
Estimated Equity
$152,695
Purchase Details
Closed on
Dec 1, 2017
Sold by
Jackson James L
Bought by
Jones Brock
Purchase Details
Closed on
Jul 24, 2013
Sold by
Jackson Virginia D
Bought by
Jackson James L
Create a Home Valuation Report for This Property
The Home Valuation Report is an in-depth analysis detailing your home's value as well as a comparison with similar homes in the area
Home Values in the Area
Average Home Value in this Area
Purchase History
| Date | Buyer | Sale Price | Title Company |
|---|---|---|---|
| Tisdale Philop D | $174,900 | -- | |
| Jones Brock | $85,000 | -- | |
| Jackson James L | -- | -- |
Source: Public Records
Mortgage History
| Date | Status | Borrower | Loan Amount |
|---|---|---|---|
| Open | Tisdale Philop D | $169,653 |
Source: Public Records
Tax History Compared to Growth
Tax History
| Year | Tax Paid | Tax Assessment Tax Assessment Total Assessment is a certain percentage of the fair market value that is determined by local assessors to be the total taxable value of land and additions on the property. | Land | Improvement |
|---|---|---|---|---|
| 2025 | $2,221 | $88,056 | $19,304 | $68,752 |
| 2024 | $2,220 | $88,056 | $19,304 | $68,752 |
| 2023 | $1,539 | $88,056 | $19,304 | $68,752 |
| 2022 | $2,315 | $64,248 | $19,304 | $44,944 |
| 2021 | $2,308 | $69,916 | $19,304 | $50,612 |
| 2020 | $2,309 | $69,916 | $19,304 | $50,612 |
| 2019 | $2,318 | $69,916 | $19,304 | $50,612 |
| 2018 | $1,393 | $34,000 | $9,400 | $24,600 |
| 2017 | $5,693 | $69,580 | $19,304 | $50,276 |
| 2016 | $2,529 | $61,301 | $9,017 | $52,284 |
| 2015 | $2,532 | $61,301 | $9,017 | $52,284 |
| 2014 | $2,535 | $61,301 | $9,017 | $52,284 |
| 2013 | -- | $61,301 | $9,017 | $52,284 |
Source: Public Records
Map
Nearby Homes
- 1616 Crest Dr
- 1806 Elmwood Dr
- 1811 Park Dr
- 1516 Shepherd Dr
- 1820 Overlook St
- 1312 10th St
- 1001 Blandford Ave
- 911 Oakview Ave
- 912 Magnolia Ave
- 1136 E Dinglewood Dr
- 752 Portland Ave
- 1103 Martin Luther King Junior Blvd
- 2551 Wynnton Rd
- 2005 7th St
- 2039 8th St
- 745 Brown Ave
- 1226 18th Ave Unit A/B
- 2113 8th St
- 2114 George St
- 1242 18th Ave