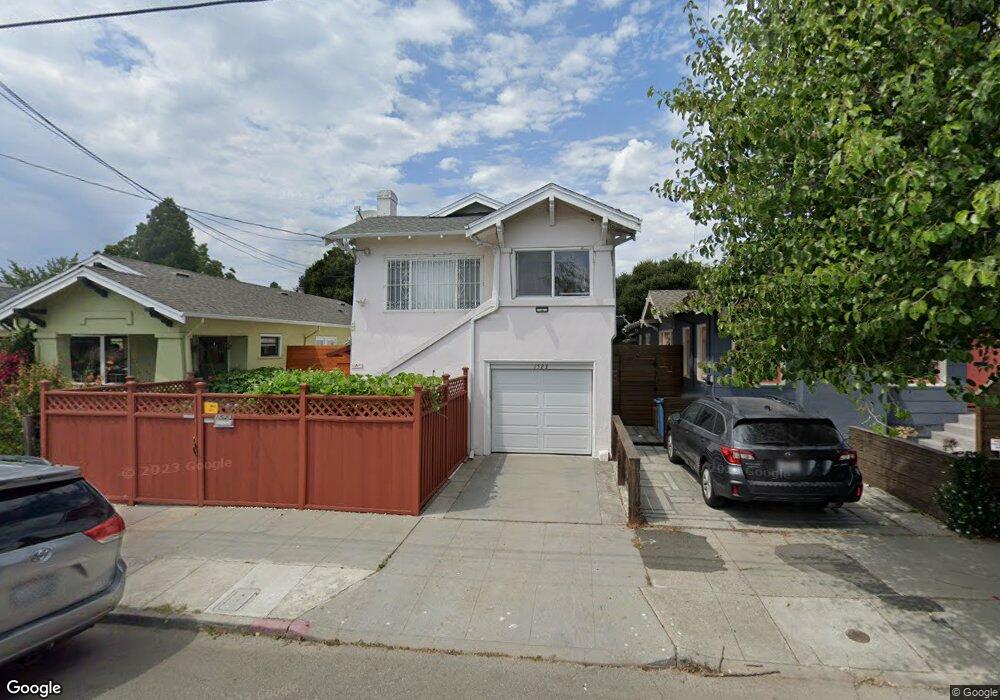
1523 Julia St Berkeley, CA 94703
South Berkeley NeighborhoodEstimated Value: $810,000 - $1,352,356
4
Beds
2
Baths
2,092
Sq Ft
$501/Sq Ft
Est. Value
About This Home
This home is located at 1523 Julia St, Berkeley, CA 94703 and is currently estimated at $1,047,839, approximately $500 per square foot. 1523 Julia St is a home located in Alameda County with nearby schools including Malcolm X Elementary School, Washington Elementary School, and Oxford Elementary School.
Ownership History
Date
Name
Owned For
Owner Type
Purchase Details
Closed on
Dec 15, 2015
Sold by
Huang Janey J Q
Bought by
Huang Janey J Q and Huang Helen
Current Estimated Value
Purchase Details
Closed on
Jul 29, 2014
Sold by
Huang Janey J Q and Huang Helen
Bought by
Huang Janey J Q
Purchase Details
Closed on
Sep 12, 2012
Sold by
Huang Janey J Q and Wong Marvin C
Bought by
Huang Janey J Q and Huang Helen
Purchase Details
Closed on
Nov 16, 2001
Sold by
Huang Janey J Q and Huang Yao Pei
Bought by
Wong Marvin C and Huang Janey J Q
Home Financials for this Owner
Home Financials are based on the most recent Mortgage that was taken out on this home.
Original Mortgage
$195,000
Interest Rate
6.63%
Create a Home Valuation Report for This Property
The Home Valuation Report is an in-depth analysis detailing your home's value as well as a comparison with similar homes in the area
Home Values in the Area
Average Home Value in this Area
Purchase History
| Date | Buyer | Sale Price | Title Company |
|---|---|---|---|
| Huang Janey J Q | -- | None Available | |
| Huang Janey J Q | -- | None Available | |
| Huang Janey J Q | -- | None Available | |
| Wong Marvin C | $65,000 | First American Title Guarant |
Source: Public Records
Mortgage History
| Date | Status | Borrower | Loan Amount |
|---|---|---|---|
| Closed | Wong Marvin C | $195,000 |
Source: Public Records
Tax History
| Year | Tax Paid | Tax Assessment Tax Assessment Total Assessment is a certain percentage of the fair market value that is determined by local assessors to be the total taxable value of land and additions on the property. | Land | Improvement |
|---|---|---|---|---|
| 2025 | $14,438 | $785,219 | $236,316 | $555,903 |
| 2024 | $14,438 | $769,686 | $231,682 | $545,004 |
| 2023 | $14,010 | $761,461 | $227,141 | $534,320 |
| 2022 | $13,609 | $739,530 | $222,687 | $523,843 |
| 2021 | $13,621 | $724,894 | $218,321 | $513,573 |
| 2020 | $12,879 | $724,392 | $216,083 | $508,309 |
| 2019 | $12,340 | $710,191 | $211,847 | $498,344 |
| 2018 | $12,095 | $696,271 | $207,695 | $488,576 |
| 2017 | $11,668 | $682,619 | $203,623 | $478,996 |
| 2016 | $11,241 | $669,235 | $199,630 | $469,605 |
| 2015 | $8,937 | $481,134 | $147,019 | $334,115 |
| 2014 | $6,691 | $307,173 | $94,778 | $212,395 |
Source: Public Records
Map
Nearby Homes
- 1535 Julia St
- 2922 Stanton St
- 1646 Ashby Ave
- 1507 Prince St
- 2790 Sacramento St
- 2782 Sacramento St
- 2774 Sacramento St
- 3101 Sacramento St
- 2758 Sacramento St
- 2926 Ellis St
- 1450 Ward St
- 2750 Sacramento St
- 3114 California St
- 3138 California St
- 1314 Ashby Ave
- 1515 Derby St
- 1612 Carleton St
- 3214 California St
- 3032 Mabel St
- 2717 Mabel St
- 1525 Julia St
- 1521 Julia St
- 1527 Julia St
- 1519 Julia St
- 1533 Julia St
- 1511 Julia St
- 1522 Russell St
- 1524 Russell St
- 1518 Russell St
- 1526 Russell St
- 1514 Russell St
- 1509 Julia St
- 1524 Julia St
- 1530 Russell St
- 1510 Russell St
- 1514 Julia St
- 1539 Julia St
- 1505 Julia St
- 1526 Julia St
- 1528 Julia St Unit one
Your Personal Tour Guide
Ask me questions while you tour the home.