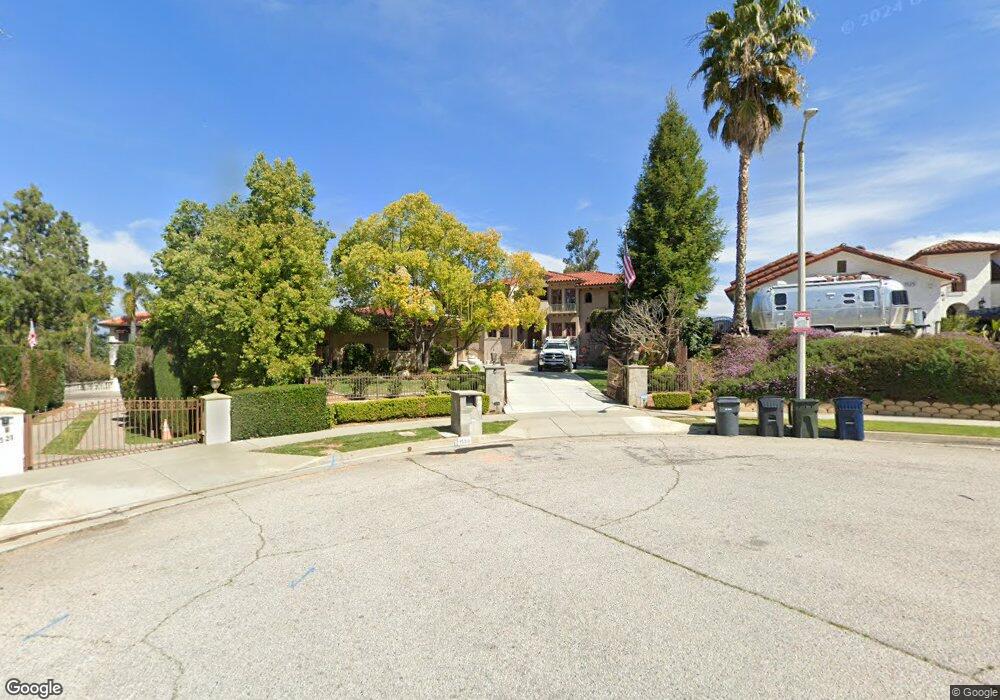
1523 Rebecca Crescent Redlands, CA 92373
South Redlands NeighborhoodEstimated Value: $1,597,000 - $2,132,000
5
Beds
5
Baths
4,730
Sq Ft
$372/Sq Ft
Est. Value
About This Home
This home is located at 1523 Rebecca Crescent, Redlands, CA 92373 and is currently estimated at $1,761,418, approximately $372 per square foot. 1523 Rebecca Crescent is a home located in San Bernardino County with nearby schools including Kimberly Elementary School, Cope Middle School, and Redlands Senior High School.
Ownership History
Date
Name
Owned For
Owner Type
Purchase Details
Closed on
Dec 21, 2012
Sold by
Grames Barry S and Grames Jami T
Bought by
Grames Barry S and Grames Jami T
Current Estimated Value
Purchase Details
Closed on
Nov 10, 2004
Sold by
Grames Barry Scott and Grames Jamie
Bought by
Grames Barry Scott and Grames Jami
Home Financials for this Owner
Home Financials are based on the most recent Mortgage that was taken out on this home.
Original Mortgage
$180,300
Interest Rate
5.72%
Mortgage Type
Credit Line Revolving
Purchase Details
Closed on
Nov 23, 2000
Sold by
Adams Mark L and Adams Betsy M
Bought by
Grames Barry and Grames Jami
Home Financials for this Owner
Home Financials are based on the most recent Mortgage that was taken out on this home.
Original Mortgage
$71,500
Interest Rate
7.71%
Purchase Details
Closed on
May 15, 2000
Sold by
Adams Mark L and Adams Betsy M
Bought by
Adams Mark L and Adams Betsy M
Purchase Details
Closed on
Jul 24, 1998
Sold by
Michaels Mike and Michaels Connie
Bought by
Adams Mark L and Adams Betsy M
Home Financials for this Owner
Home Financials are based on the most recent Mortgage that was taken out on this home.
Original Mortgage
$88,000
Interest Rate
9%
Mortgage Type
Balloon
Create a Home Valuation Report for This Property
The Home Valuation Report is an in-depth analysis detailing your home's value as well as a comparison with similar homes in the area
Home Values in the Area
Average Home Value in this Area
Purchase History
| Date | Buyer | Sale Price | Title Company |
|---|---|---|---|
| Grames Barry S | -- | None Available | |
| Grames Barry Scott | -- | Fidelity Natl Tustin | |
| Grames Barry | $125,000 | Commonwealth Land Title Co | |
| Adams Mark L | -- | -- | |
| Adams Mark L | $110,000 | Chicago Title Co |
Source: Public Records
Mortgage History
| Date | Status | Borrower | Loan Amount |
|---|---|---|---|
| Closed | Grames Barry Scott | $180,300 | |
| Closed | Grames Barry | $71,500 | |
| Previous Owner | Adams Mark L | $88,000 |
Source: Public Records
Tax History Compared to Growth
Tax History
| Year | Tax Paid | Tax Assessment Tax Assessment Total Assessment is a certain percentage of the fair market value that is determined by local assessors to be the total taxable value of land and additions on the property. | Land | Improvement |
|---|---|---|---|---|
| 2025 | $13,476 | $1,059,448 | $188,357 | $871,091 |
| 2024 | $13,476 | $1,038,675 | $184,664 | $854,011 |
| 2023 | $13,460 | $1,018,309 | $181,043 | $837,266 |
| 2022 | $13,281 | $998,342 | $177,493 | $820,849 |
| 2021 | $12,189 | $978,767 | $174,013 | $804,754 |
| 2020 | $13,317 | $968,731 | $172,229 | $796,502 |
| 2019 | $12,977 | $949,736 | $168,852 | $780,884 |
| 2018 | $12,682 | $931,114 | $165,541 | $765,573 |
| 2017 | $12,585 | $912,857 | $162,295 | $750,562 |
| 2016 | $12,455 | $894,958 | $159,113 | $735,845 |
| 2015 | $12,372 | $881,515 | $156,723 | $724,792 |
| 2014 | $12,168 | $864,247 | $153,653 | $710,594 |
Source: Public Records
Map
Nearby Homes
- 1037 W Sunset Dr
- 1327 Monterey St
- 1349 S Center St
- 724 W Sunset Dr
- 848 W Sunset Dr
- 1 Sunset Dr
- 1533 Serpentine Dr
- 1228 S Center St
- 1377 Knoll Rd
- 1515 Elizabeth St
- 529 Manzanita Rd
- 805 Nottingham Dr
- 1702 Dwight St
- 527 W Palm Ave
- 220 W Highland Ave
- 1710 Fairmont Dr
- 1471 Rosehill Crescent
- 1627 Halsey St
- 636 Harding Dr
- 622 Esther Way
- 1525 Rebecca Crescent
- 1521 Rebecca Crescent
- 1527 Rebecca Crest
- 1527 Rebecca Crescent
- 1531 Rebecca Crescent
- 1535 Alessandro Rd
- 1446 Kincaid St
- 1515 Alessandro Rd
- 1533 Rebecca Crescent
- 1535 Rebecca Crescent
- 1510 Cameo Dr
- 1516 Cameo Dr
- 1541 Rebecca Crescent
- 1504 Cameo Dr
- 1522 Cameo Dr
- 1537 Rebecca Crescent
- 1455 Sterling Rd
- 1528 Cameo Dr
- 1511 Cameo Dr
- 0 Kincaide Unit E09033330