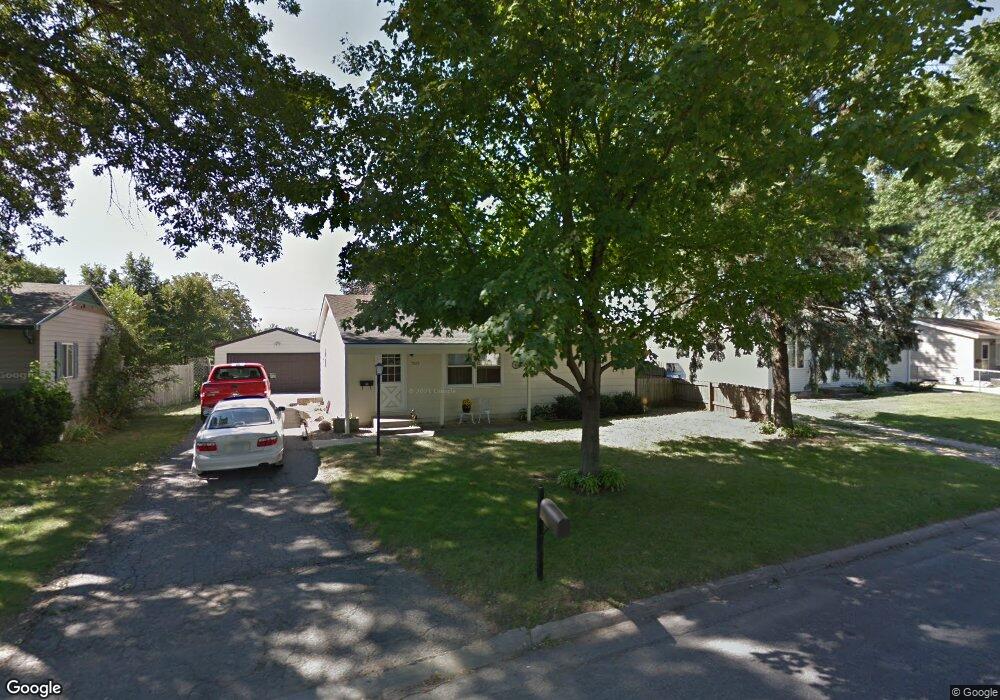
1523 Wakonda Dr Waterloo, IA 50703
Greenbrier NeighborhoodEstimated Value: $138,000 - $161,000
4
Beds
1
Bath
1,749
Sq Ft
$88/Sq Ft
Est. Value
About This Home
This home is located at 1523 Wakonda Dr, Waterloo, IA 50703 and is currently estimated at $153,180, approximately $87 per square foot. 1523 Wakonda Dr is a home located in Black Hawk County with nearby schools including Lincoln Elementary School, George Washington Carver Academy, and East High School.
Ownership History
Date
Name
Owned For
Owner Type
Purchase Details
Closed on
Jul 15, 2014
Sold by
Widmann Joseph M and Widmann Emily J
Bought by
Soteros Amber
Current Estimated Value
Home Financials for this Owner
Home Financials are based on the most recent Mortgage that was taken out on this home.
Original Mortgage
$95,645
Outstanding Balance
$72,744
Interest Rate
4.12%
Mortgage Type
FHA
Estimated Equity
$80,436
Purchase Details
Closed on
Jan 29, 2013
Sold by
Widmann Emily J and Morrison Emily G
Bought by
Widmann Emily J and Widmann Joseph M
Home Financials for this Owner
Home Financials are based on the most recent Mortgage that was taken out on this home.
Original Mortgage
$71,261
Interest Rate
3.87%
Mortgage Type
FHA
Purchase Details
Closed on
Apr 29, 2008
Sold by
Snell Deon E and Snell Lois J
Bought by
Morrison Emily and Widmann Joseph M
Home Financials for this Owner
Home Financials are based on the most recent Mortgage that was taken out on this home.
Original Mortgage
$75,404
Interest Rate
5.93%
Mortgage Type
FHA
Create a Home Valuation Report for This Property
The Home Valuation Report is an in-depth analysis detailing your home's value as well as a comparison with similar homes in the area
Home Values in the Area
Average Home Value in this Area
Purchase History
| Date | Buyer | Sale Price | Title Company |
|---|---|---|---|
| Soteros Amber | $97,500 | Black Hawk County Abstract & | |
| Widmann Emily J | -- | None Available | |
| Morrison Emily | $76,000 | Black Hawk County Abstract & |
Source: Public Records
Mortgage History
| Date | Status | Borrower | Loan Amount |
|---|---|---|---|
| Open | Soteros Amber | $95,645 | |
| Previous Owner | Widmann Emily J | $71,261 | |
| Previous Owner | Morrison Emily | $75,404 |
Source: Public Records
Tax History Compared to Growth
Tax History
| Year | Tax Paid | Tax Assessment Tax Assessment Total Assessment is a certain percentage of the fair market value that is determined by local assessors to be the total taxable value of land and additions on the property. | Land | Improvement |
|---|---|---|---|---|
| 2024 | $2,322 | $117,260 | $17,550 | $99,710 |
| 2023 | $1,884 | $117,260 | $17,550 | $99,710 |
| 2022 | $1,832 | $94,680 | $17,550 | $77,130 |
| 2021 | $1,760 | $94,680 | $17,550 | $77,130 |
| 2020 | $1,728 | $86,340 | $13,500 | $72,840 |
| 2019 | $1,728 | $86,340 | $13,500 | $72,840 |
| 2018 | $1,730 | $86,290 | $13,500 | $72,790 |
| 2017 | $1,884 | $86,290 | $13,500 | $72,790 |
| 2016 | $1,856 | $90,570 | $13,500 | $77,070 |
| 2015 | $1,856 | $90,570 | $13,500 | $77,070 |
| 2014 | $1,694 | $82,010 | $13,500 | $68,510 |
Source: Public Records
Map
Nearby Homes
- 742 Cloverdale Ave
- 231 Mckay Ave Unit 235
- 1128 Newton St
- 1035 Newton St
- 1250 W Airline Hwy
- 1061 Riehl St
- 848 Kern St
- 708 Newton St
- 618 Kern St
- 545 W Parker St
- 0.791 Acres W Louise St
- 114 Hanna Blvd
- 713 Riehl St
- 201 Joy Dr
- 1018 Fairview Ave
- 542 Kern St
- 2.29 Acres Ansborough Ave
- 211 Auburn St
- 216 Desoto Ave
- 1114 Maynard Ave
- 1529 Wakonda Dr
- 1517 Wakonda Dr
- 1537 Wakonda Dr
- 1522 Wakonda Dr
- 1516 Wakonda Dr
- 1530 Wakonda Dr
- 1543 Wakonda Dr
- 1536 Wakonda Dr
- 1506 Wakonda Dr Unit 1508
- 1547 Wakonda Dr
- 1542 Wakonda Dr
- 1523 Woodmayr Dr
- 1537 Woodmayr Dr
- 1548 Wakonda Dr
- 1531 Woodmayr Dr
- 1553 Wakonda Dr
- 1517 Woodmayr Dr
- 1543 Woodmayr Dr
- 1554 Wakonda Dr
- 1559 Wakonda Dr