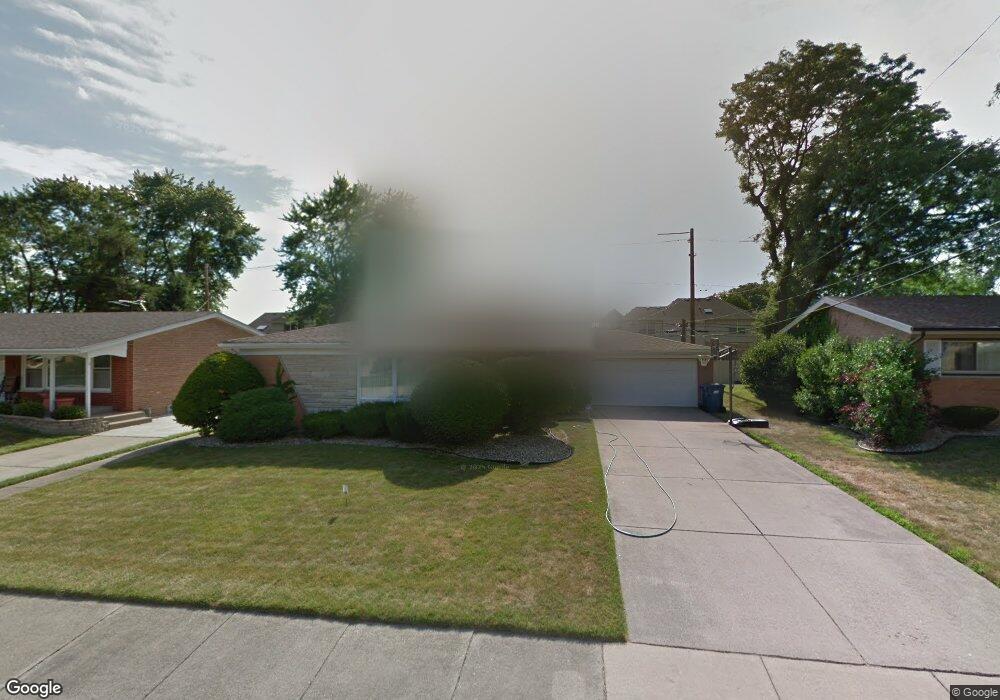
15230 Drexel Ave South Holland, IL 60473
Estimated Value: $203,000 - $239,000
3
Beds
2
Baths
1,480
Sq Ft
$152/Sq Ft
Est. Value
About This Home
This home is located at 15230 Drexel Ave, South Holland, IL 60473 and is currently estimated at $225,428, approximately $152 per square foot. 15230 Drexel Ave is a home located in Cook County with nearby schools including Diekman Elementary School, Creative Communications Academy, and School Of Fine Arts Academy.
Ownership History
Date
Name
Owned For
Owner Type
Purchase Details
Closed on
Jan 10, 2022
Sold by
Grady John
Bought by
Grady John G and Grady Marilyn R
Current Estimated Value
Purchase Details
Closed on
Dec 13, 2006
Sold by
Johnson Wiley
Bought by
Grady John
Home Financials for this Owner
Home Financials are based on the most recent Mortgage that was taken out on this home.
Original Mortgage
$35,000
Interest Rate
6.36%
Mortgage Type
Stand Alone Second
Purchase Details
Closed on
Aug 24, 2004
Sold by
Logan Jane
Bought by
Johnson Wiley
Home Financials for this Owner
Home Financials are based on the most recent Mortgage that was taken out on this home.
Original Mortgage
$123,200
Interest Rate
6.1%
Mortgage Type
New Conventional
Create a Home Valuation Report for This Property
The Home Valuation Report is an in-depth analysis detailing your home's value as well as a comparison with similar homes in the area
Home Values in the Area
Average Home Value in this Area
Purchase History
| Date | Buyer | Sale Price | Title Company |
|---|---|---|---|
| Grady John G | -- | None Listed On Document | |
| Grady John | $175,000 | Cti | |
| Johnson Wiley | $154,000 | Cti |
Source: Public Records
Mortgage History
| Date | Status | Borrower | Loan Amount |
|---|---|---|---|
| Previous Owner | Grady John | $35,000 | |
| Previous Owner | Johnson Wiley | $123,200 | |
| Closed | Johnson Wiley | $30,800 |
Source: Public Records
Tax History Compared to Growth
Tax History
| Year | Tax Paid | Tax Assessment Tax Assessment Total Assessment is a certain percentage of the fair market value that is determined by local assessors to be the total taxable value of land and additions on the property. | Land | Improvement |
|---|---|---|---|---|
| 2024 | $6,602 | $19,000 | $3,092 | $15,908 |
| 2023 | $4,653 | $19,000 | $3,092 | $15,908 |
| 2022 | $4,653 | $13,328 | $2,729 | $10,599 |
| 2021 | $4,446 | $13,327 | $2,728 | $10,599 |
| 2020 | $4,377 | $13,327 | $2,728 | $10,599 |
| 2019 | $4,535 | $10,897 | $2,546 | $8,351 |
| 2018 | $4,481 | $10,897 | $2,546 | $8,351 |
| 2017 | $4,393 | $10,897 | $2,546 | $8,351 |
| 2016 | $4,304 | $10,149 | $2,364 | $7,785 |
| 2015 | $4,073 | $10,149 | $2,364 | $7,785 |
| 2014 | $4,014 | $10,149 | $2,364 | $7,785 |
| 2013 | $3,930 | $10,573 | $2,364 | $8,209 |
Source: Public Records
Map
Nearby Homes
- 15317 Drexel Ave
- 1020 E 153rd St
- 15223 Cottage Grove Ave
- 15354 Dobson Ave
- 15401 Ellis Ave
- 1134 E 152nd St
- 15413 Dobson Ave
- 15240 Woodlawn Ave
- 1138 E 151st St
- 749 E 154th St
- 717 E 154th St
- 15415 Woodlawn Ave E
- 15134 Hastings Dr
- 15501 Maryland Ave
- 15427 Minerva Ave
- 1212 E 151st St
- 1204 E 154th St
- 15215 Hastings Dr
- 15501 Rose Dr
- 15041 Irving Ave
- 15236 Drexel Ave
- 15224 Drexel Ave
- 15223 Naughton Dr
- 15229 Naughton Dr
- 15242 Drexel Ave
- 15218 Drexel Ave
- 15229 Drexel Ave
- 15217 Naughton Dr
- 15235 Naughton Dr
- 15235 Drexel Ave
- 15223 Drexel Ave
- 15212 Drexel Ave
- 15248 Drexel Ave
- 15241 Drexel Ave
- 15217 Drexel Ave
- 15211 Naughton Dr
- 15241 Naughton Dr
- 15247 Drexel Ave
- 15211 Drexel Ave
- 15234 Ingleside Ave