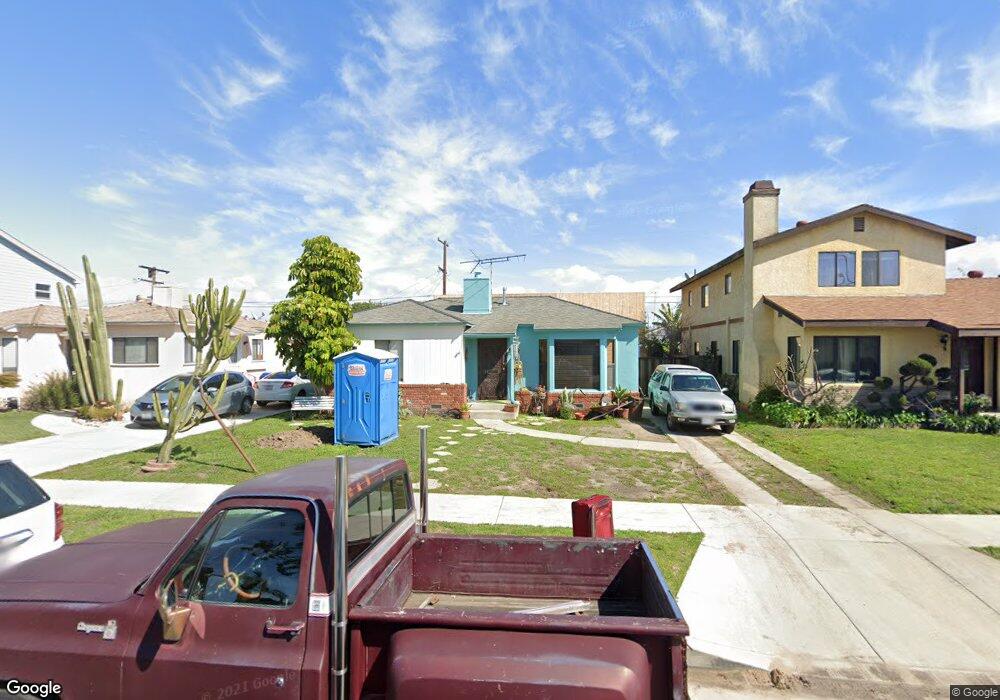
15236 Ermanita Ave Gardena, CA 90249
El Camino Village NeighborhoodEstimated Value: $555,000 - $998,000
3
Beds
3
Baths
1,715
Sq Ft
$472/Sq Ft
Est. Value
About This Home
This home is located at 15236 Ermanita Ave, Gardena, CA 90249 and is currently estimated at $808,885, approximately $471 per square foot. 15236 Ermanita Ave is a home located in Los Angeles County with nearby schools including Mark Twain Elementary School, Will Rogers Middle School, and Leuzinger High School.
Ownership History
Date
Name
Owned For
Owner Type
Purchase Details
Closed on
Aug 10, 2016
Sold by
Johnson James Lee
Bought by
Johnson James Lee and Rossi Johnson Anabela Silvana
Current Estimated Value
Home Financials for this Owner
Home Financials are based on the most recent Mortgage that was taken out on this home.
Original Mortgage
$266,000
Outstanding Balance
$211,756
Interest Rate
3.41%
Mortgage Type
New Conventional
Estimated Equity
$597,129
Purchase Details
Closed on
May 23, 2016
Sold by
Johnson James Lee
Bought by
Johnson Rossi Trust
Purchase Details
Closed on
Mar 5, 1999
Sold by
Sides John S
Bought by
Johnson James Lee and Johnson Anabela Rossi
Home Financials for this Owner
Home Financials are based on the most recent Mortgage that was taken out on this home.
Original Mortgage
$169,019
Interest Rate
6.73%
Mortgage Type
FHA
Create a Home Valuation Report for This Property
The Home Valuation Report is an in-depth analysis detailing your home's value as well as a comparison with similar homes in the area
Home Values in the Area
Average Home Value in this Area
Purchase History
| Date | Buyer | Sale Price | Title Company |
|---|---|---|---|
| Johnson James Lee | -- | Chicago Title Company | |
| Johnson James Lee | -- | Chicago Title Company | |
| Johnson Rossi Trust | -- | Chicago Title Company | |
| Johnson James Lee | $170,500 | First American |
Source: Public Records
Mortgage History
| Date | Status | Borrower | Loan Amount |
|---|---|---|---|
| Open | Johnson James Lee | $266,000 | |
| Closed | Johnson James Lee | $169,019 |
Source: Public Records
Tax History Compared to Growth
Tax History
| Year | Tax Paid | Tax Assessment Tax Assessment Total Assessment is a certain percentage of the fair market value that is determined by local assessors to be the total taxable value of land and additions on the property. | Land | Improvement |
|---|---|---|---|---|
| 2025 | $6,367 | $475,126 | $213,514 | $261,612 |
| 2024 | $6,367 | $465,811 | $209,328 | $256,483 |
| 2023 | $6,039 | $456,678 | $205,224 | $251,454 |
| 2022 | $5,973 | $362,645 | $201,200 | $161,445 |
| 2021 | $4,829 | $355,535 | $197,255 | $158,280 |
| 2019 | $1,407 | $239,176 | $191,405 | $47,771 |
| 2018 | $3,288 | $234,487 | $187,652 | $46,835 |
| 2016 | $3,035 | $225,383 | $180,366 | $45,017 |
| 2015 | $2,959 | $221,998 | $177,657 | $44,341 |
| 2014 | $2,943 | $217,650 | $174,177 | $43,473 |
Source: Public Records
Map
Nearby Homes
- 15309 Patronella Ave
- 3351 Marine Ave
- 3245 Marine Ave
- 15522 Faysmith Ave
- 15132 Kornblum Ave
- 3129 Marine Ave Unit 7
- 3719 W 154th St
- 15302 Doty Ave
- 15200 Atkinson Ave
- 14835 Wadkins Ave
- 14540 Yukon Ave
- 14526 Chadron Ave
- 14751 Wadkins Ave
- 14405 Cerise Ave Unit 35
- 2817 W 146th St
- 14324 Chadron Ave
- 14709 Bodger Ave
- 3609 W 144th St
- 2612 Manhattan Beach Blvd
- 14623 Roxton Ave
- 15232 Ermanita Ave
- 15302 Ermanita Ave
- 15228 Ermanita Ave
- 15226 Ermanita Ave
- 15306 Ermanita Ave
- 15239 Faysmith Ave
- 15233 Faysmith Ave
- 15222 Ermanita Ave
- 15312 Ermanita Ave
- 15229 Faysmith Ave
- 15309 Faysmith Ave
- 15237 Ermanita Ave
- 15233 Ermanita Ave
- 15303 Ermanita Ave
- 15313 Faysmith Ave
- 15223 Faysmith Ave
- 15227 Ermanita Ave
- 15307 Ermanita Ave
- 15216 Ermanita Ave