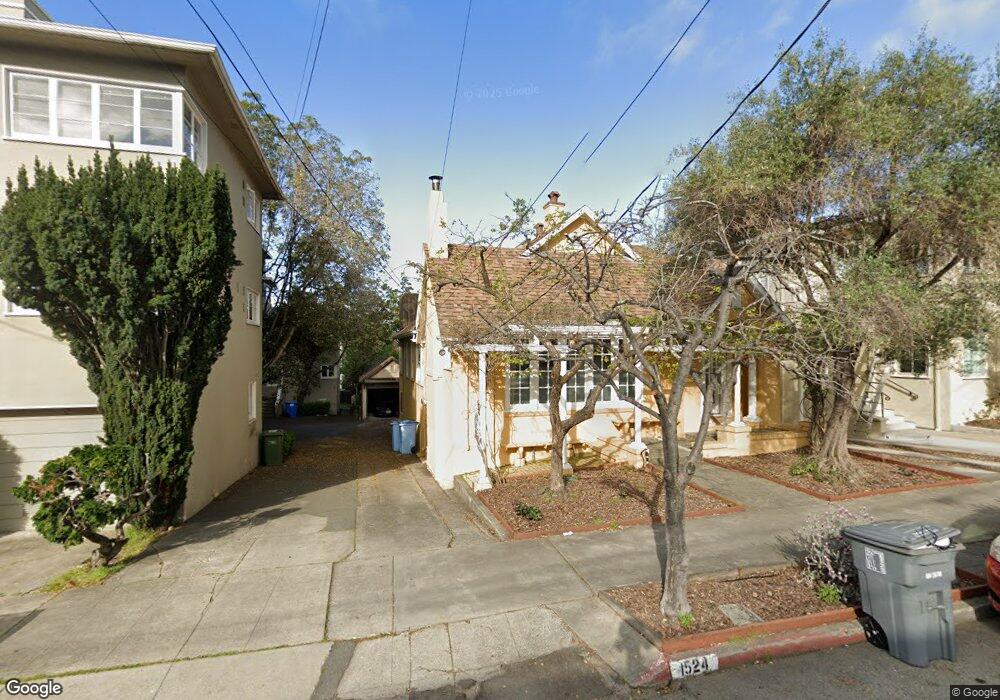
1524 Arch St Berkeley, CA 94708
North Berkeley NeighborhoodEstimated Value: $937,000 - $1,794,969
4
Beds
4
Baths
2,234
Sq Ft
$624/Sq Ft
Est. Value
About This Home
This home is located at 1524 Arch St, Berkeley, CA 94708 and is currently estimated at $1,393,242, approximately $623 per square foot. 1524 Arch St is a home located in Alameda County with nearby schools including Berkeley Arts Magnet at Whittier School, Cragmont Elementary School, and Washington Elementary School.
Ownership History
Date
Name
Owned For
Owner Type
Purchase Details
Closed on
Feb 21, 2019
Sold by
Yoon Sung
Bought by
The Sung Yoon Living Trust
Current Estimated Value
Purchase Details
Closed on
Feb 25, 2010
Sold by
Kamburov Jung S
Bought by
Yoon Sung
Purchase Details
Closed on
Aug 26, 1998
Sold by
Schwartz Herb
Bought by
Kamburov Jung S and Yoon Sung
Home Financials for this Owner
Home Financials are based on the most recent Mortgage that was taken out on this home.
Original Mortgage
$373,500
Interest Rate
6.91%
Purchase Details
Closed on
Aug 12, 1998
Sold by
Kamburov Svetozar
Bought by
Kamburov Jung
Home Financials for this Owner
Home Financials are based on the most recent Mortgage that was taken out on this home.
Original Mortgage
$373,500
Interest Rate
6.91%
Purchase Details
Closed on
Feb 2, 1996
Sold by
Schwartz Herb
Bought by
Schwartz Herb
Create a Home Valuation Report for This Property
The Home Valuation Report is an in-depth analysis detailing your home's value as well as a comparison with similar homes in the area
Home Values in the Area
Average Home Value in this Area
Purchase History
| Date | Buyer | Sale Price | Title Company |
|---|---|---|---|
| The Sung Yoon Living Trust | -- | None Available | |
| Yoon Sung | -- | First American Title | |
| Kamburov Jung S | $498,000 | Old Republic Title Company | |
| Kamburov Jung | -- | Old Republic Title Company | |
| Schwartz Herb | -- | -- |
Source: Public Records
Mortgage History
| Date | Status | Borrower | Loan Amount |
|---|---|---|---|
| Previous Owner | Kamburov Jung S | $373,500 |
Source: Public Records
Tax History
| Year | Tax Paid | Tax Assessment Tax Assessment Total Assessment is a certain percentage of the fair market value that is determined by local assessors to be the total taxable value of land and additions on the property. | Land | Improvement |
|---|---|---|---|---|
| 2025 | $13,476 | $780,674 | $234,202 | $546,472 |
| 2024 | $13,476 | $765,370 | $229,611 | $535,759 |
| 2023 | $13,182 | $750,365 | $225,109 | $525,256 |
| 2022 | $13,329 | $735,654 | $220,696 | $514,958 |
| 2021 | $12,919 | $721,233 | $216,370 | $504,863 |
| 2020 | $12,128 | $713,837 | $214,151 | $499,686 |
| 2019 | $11,547 | $699,844 | $209,953 | $489,891 |
| 2018 | $11,334 | $686,124 | $205,837 | $480,287 |
| 2017 | $10,932 | $672,673 | $201,802 | $470,871 |
| 2016 | $10,516 | $659,485 | $197,845 | $461,640 |
| 2015 | $10,367 | $649,580 | $194,874 | $454,706 |
| 2014 | $10,359 | $636,857 | $191,057 | $445,800 |
Source: Public Records
Map
Nearby Homes
- 1515 Oxford St Unit 1D
- 1622 Scenic Ave
- 1444 Walnut St
- 2421 Hilgard Ave
- 2301 Virginia St Unit 1
- 2340 Virginia St
- 2201 Virginia St Unit 2
- 1682 Oxford St
- 2477 Virginia St
- 2501 Rose Walk
- 2451 Le Conte Ave
- 1739 Spruce St
- 1408 Henry St
- 2600 Hilgard Ave
- 2035 Francisco St
- 1610 Milvia St
- 2634 Virginia St Unit 33
- 2315 Eunice St
- 2121 Eunice St
- 1609 Bonita Ave Unit 5
Your Personal Tour Guide
Ask me questions while you tour the home.