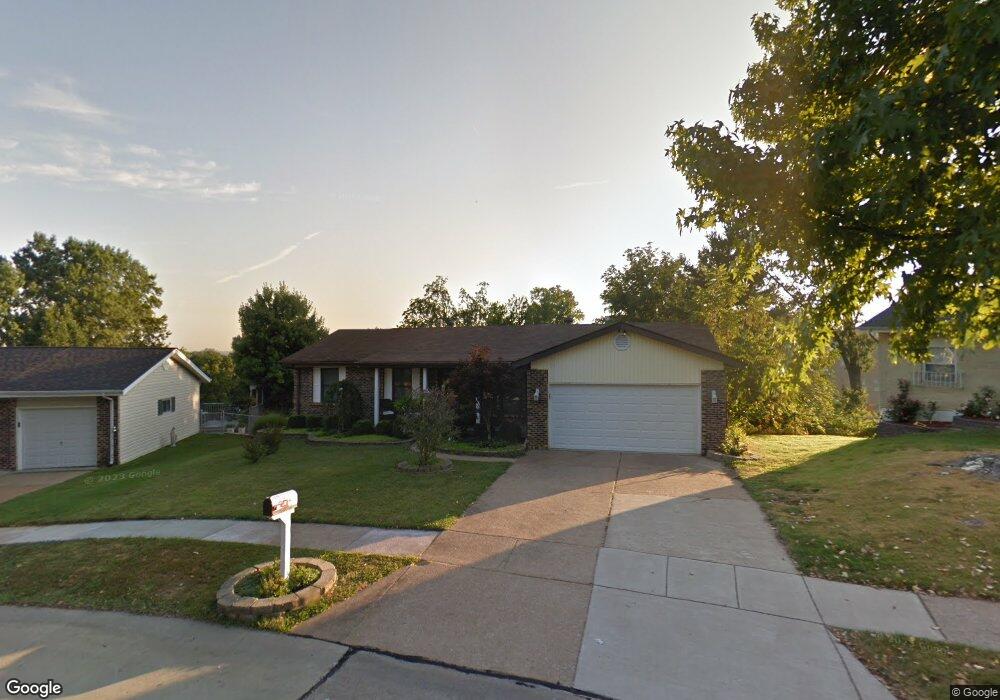
1524 Bradington Dr Fenton, MO 63026
Estimated Value: $297,631 - $334,000
3
Beds
2
Baths
1,256
Sq Ft
$251/Sq Ft
Est. Value
About This Home
This home is located at 1524 Bradington Dr, Fenton, MO 63026 and is currently estimated at $315,408, approximately $251 per square foot. 1524 Bradington Dr is a home located in St. Louis County with nearby schools including Uthoff Valley Elementary School, Rockwood South Middle School, and Rockwood Summit Senior High School.
Ownership History
Date
Name
Owned For
Owner Type
Purchase Details
Closed on
Jun 28, 2006
Sold by
James David S and James Amy
Bought by
Jackson Brandon G and Jackson Melanie
Current Estimated Value
Home Financials for this Owner
Home Financials are based on the most recent Mortgage that was taken out on this home.
Original Mortgage
$156,400
Outstanding Balance
$92,902
Interest Rate
6.66%
Mortgage Type
Purchase Money Mortgage
Estimated Equity
$222,506
Purchase Details
Closed on
Mar 31, 2006
Sold by
Kaiser Steven Paul
Bought by
James David S
Home Financials for this Owner
Home Financials are based on the most recent Mortgage that was taken out on this home.
Original Mortgage
$141,110
Interest Rate
6.22%
Mortgage Type
Fannie Mae Freddie Mac
Purchase Details
Closed on
Jun 12, 1997
Sold by
Kaiser Steven P and Kaiser Susan R
Bought by
Kaiser Steven Paul
Create a Home Valuation Report for This Property
The Home Valuation Report is an in-depth analysis detailing your home's value as well as a comparison with similar homes in the area
Home Values in the Area
Average Home Value in this Area
Purchase History
| Date | Buyer | Sale Price | Title Company |
|---|---|---|---|
| Jackson Brandon G | $195,500 | Clt | |
| James David S | $141,110 | Sec | |
| Kaiser Steven Paul | -- | -- |
Source: Public Records
Mortgage History
| Date | Status | Borrower | Loan Amount |
|---|---|---|---|
| Open | Jackson Brandon G | $156,400 | |
| Previous Owner | James David S | $141,110 |
Source: Public Records
Tax History Compared to Growth
Tax History
| Year | Tax Paid | Tax Assessment Tax Assessment Total Assessment is a certain percentage of the fair market value that is determined by local assessors to be the total taxable value of land and additions on the property. | Land | Improvement |
|---|---|---|---|---|
| 2025 | $3,541 | $53,980 | $26,710 | $27,270 |
| 2024 | $3,541 | $47,430 | $19,630 | $27,800 |
| 2023 | $3,541 | $47,430 | $19,630 | $27,800 |
| 2022 | $3,241 | $40,470 | $17,440 | $23,030 |
| 2021 | $3,216 | $40,470 | $17,440 | $23,030 |
| 2020 | $3,198 | $38,690 | $17,940 | $20,750 |
| 2019 | $3,208 | $38,690 | $17,940 | $20,750 |
| 2018 | $3,075 | $35,580 | $14,000 | $21,580 |
| 2017 | $3,051 | $35,580 | $14,000 | $21,580 |
| 2016 | $2,591 | $30,470 | $10,200 | $20,270 |
| 2015 | $2,538 | $30,470 | $10,200 | $20,270 |
| 2014 | $2,616 | $30,630 | $8,440 | $22,190 |
Source: Public Records
Map
Nearby Homes
- 1719 Chestnut Farms Ct
- 1107 Coronita Way
- 2209 Fenway Farms Trail
- 1808 Dover Trace Dr
- 1851 Hawkins Place
- 683 Greenholme Ct
- 1818 Charles Thomas Ln
- 678 Greensleeves Dr
- 2017 Brutus Ct
- 82 May Valley Ln
- 1575 Uthoff Dr
- 1655 Valley Park Rd
- 1881 San Pedro Ln
- 1710 Stemwood Way
- 1702 Stemwood Way
- 1883 San Lucas Ln
- 1800 Harbor Mill Dr
- 1923 Smizer Mill Rd
- 161 Majestic Dr
- 88 Lucie Ln
- 1520 Bradington Dr
- 1528 Bradington Dr
- 2520 Guebert Rd
- 2518 Guebert Rd
- 1516 Bradington Dr
- 1532 Bradington Dr
- 2516 Guebert Rd
- 1529 Bradington Dr
- 1515 Bradington Dr
- 1512 Bradington Dr
- 2514 Guebert Rd
- 1536 Bradington Dr
- 2527 Dimus Dr
- 1535 Bradington Dr
- 1511 Bradington Dr
- 2512 Guebert Rd
- 1508 Bradington Dr
- 2517 Guebert Rd
- 2525 Dimus Dr
- 1540 Bradington Dr