Estimated Value: $179,000 - $549,000
4
Beds
2
Baths
1,490
Sq Ft
$297/Sq Ft
Est. Value
About This Home
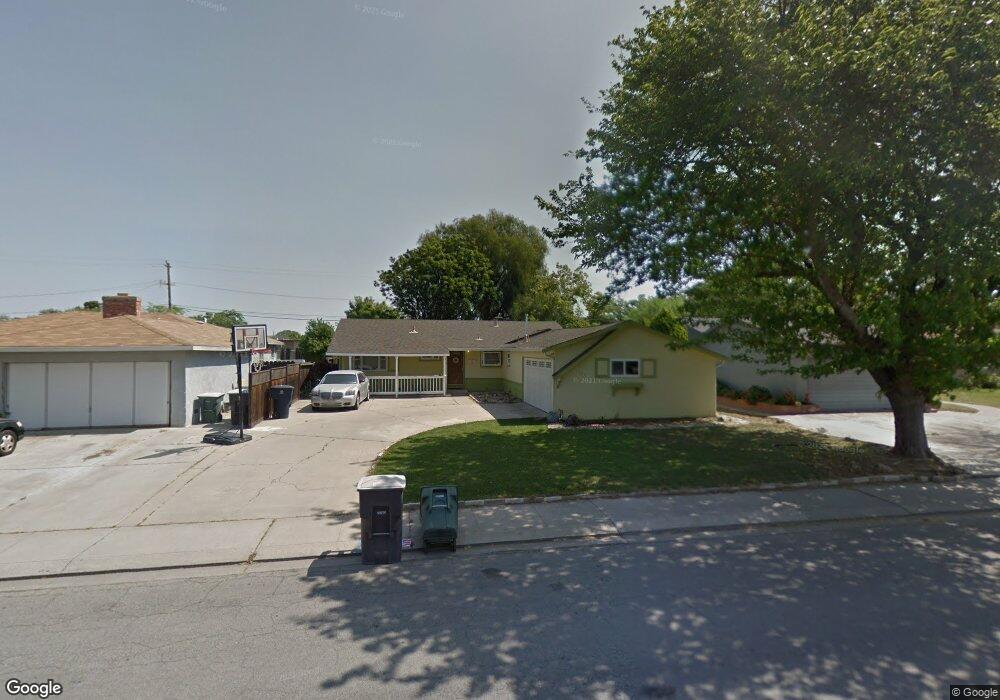
This home is located at 1524 Chester Dr, Tracy, CA 95376 and is currently estimated at $442,204, approximately $296 per square foot. 1524 Chester Dr is a home located in San Joaquin County with nearby schools including McKinley Elementary School, Monte Vista Middle School, and Merrill F. West High School.
Ownership History
Date
Name
Owned For
Owner Type
Purchase Details
Closed on
Jul 13, 2010
Sold by
Wells Fargo Bank Na
Bought by
Roush Stephanie
Current Estimated Value
Home Financials for this Owner
Home Financials are based on the most recent Mortgage that was taken out on this home.
Original Mortgage
$153,375
Outstanding Balance
$100,792
Interest Rate
4.5%
Mortgage Type
FHA
Estimated Equity
$341,412
Purchase Details
Closed on
May 14, 2010
Sold by
Garcia Teresa M
Bought by
Wells Fargo Bank Na
Home Financials for this Owner
Home Financials are based on the most recent Mortgage that was taken out on this home.
Original Mortgage
$153,375
Outstanding Balance
$100,792
Interest Rate
4.5%
Mortgage Type
FHA
Estimated Equity
$341,412
Purchase Details
Closed on
Jan 27, 1995
Sold by
Erichsen David A and Erichsen Linda K
Bought by
Garcia Pete Kelly and Garcia Teresa M
Home Financials for this Owner
Home Financials are based on the most recent Mortgage that was taken out on this home.
Original Mortgage
$153,017
Interest Rate
9.2%
Mortgage Type
FHA
Create a Home Valuation Report for This Property
The Home Valuation Report is an in-depth analysis detailing your home's value as well as a comparison with similar homes in the area
Home Values in the Area
Average Home Value in this Area
Purchase History
| Date | Buyer | Sale Price | Title Company |
|---|---|---|---|
| Roush Stephanie | $160,000 | Old Republic Title Company | |
| Wells Fargo Bank Na | $142,264 | Accommodation | |
| Garcia Pete Kelly | $156,500 | Old Republic Title Company |
Source: Public Records
Mortgage History
| Date | Status | Borrower | Loan Amount |
|---|---|---|---|
| Open | Roush Stephanie | $153,375 | |
| Previous Owner | Garcia Pete Kelly | $153,017 |
Source: Public Records
Tax History
| Year | Tax Paid | Tax Assessment Tax Assessment Total Assessment is a certain percentage of the fair market value that is determined by local assessors to be the total taxable value of land and additions on the property. | Land | Improvement |
|---|---|---|---|---|
| 2025 | $2,294 | $204,978 | $51,242 | $153,736 |
| 2024 | $2,113 | $200,960 | $50,238 | $150,722 |
| 2023 | $2,079 | $197,020 | $49,253 | $147,767 |
| 2022 | $2,035 | $193,158 | $48,288 | $144,870 |
| 2021 | $3,549 | $189,372 | $47,342 | $142,030 |
| 2020 | $3,536 | $187,431 | $46,857 | $140,574 |
| 2019 | $3,503 | $183,757 | $45,939 | $137,818 |
| 2018 | $3,464 | $180,155 | $45,039 | $135,116 |
| 2017 | $3,371 | $176,623 | $44,156 | $132,467 |
| 2016 | $1,852 | $173,160 | $43,290 | $129,870 |
| 2014 | $1,728 | $167,219 | $41,805 | $125,414 |
Source: Public Records
Map
Nearby Homes
- 1416 Audrey Dr
- 1506 Madison Ave
- 539 W Lowell Ave
- 1651 W Beverly Place
- 875 Westleigh Ct
- 445 W Lowell Ave
- 1330 Bessie Ave
- 2198 Walsingham Ct
- 1533 Vinewood Way
- 1463 Evergreen Ct
- 2270 Chester Dr
- 1823 Wall St
- 1930 Wall St
- 1636 Parker Ave
- 262 W Lowell Ave
- 1540 Meadow Lark Ln
- 319 W 12th St
- 522 W Grant Line Rd
- 508 W Grant Line Rd
- 829 Palm Cir
- 1530 Chester Dr
- 1518 Chester Dr
- 1512 Chester Dr
- 1536 Chester Dr
- 1525 Chester Dr
- 1506 Chester Dr
- 1542 Chester Dr
- 1537 Chester Dr
- 1125 Marlin Place
- 1600 Chester Dr
- 1124 Linda Place
- 1035 W Beverly Place
- 1500 Chester Dr
- 1015 W Beverly Place
- 1124 Marlin Place
- 1135 Marlin Place
- 945 W Beverly Place
- 1501 Chester Dr
- 1134 Linda Place
- 1606 Chester Dr
Your Personal Tour Guide
Ask me questions while you tour the home.