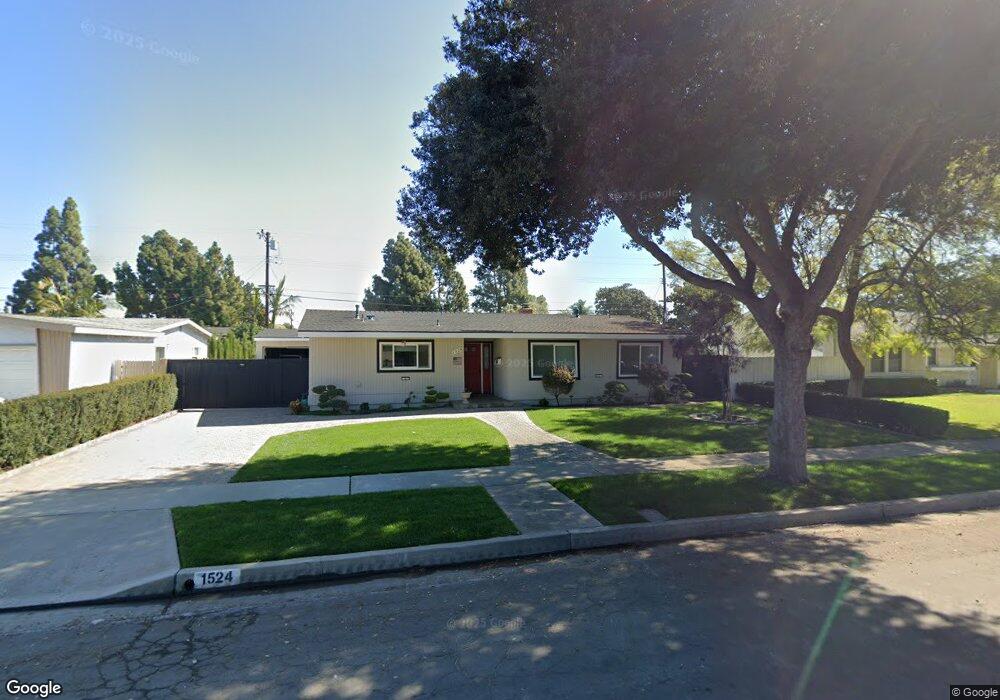
1524 S Lovering Ave Fullerton, CA 92833
Estimated Value: $916,000 - $993,000
3
Beds
2
Baths
1,536
Sq Ft
$622/Sq Ft
Est. Value
About This Home
This home is located at 1524 S Lovering Ave, Fullerton, CA 92833 and is currently estimated at $954,881, approximately $621 per square foot. 1524 S Lovering Ave is a home located in Orange County with nearby schools including Orangethorpe Elementary School, Nicolas Junior High School, and Fullerton Union High School.
Ownership History
Date
Name
Owned For
Owner Type
Purchase Details
Closed on
Nov 8, 2000
Sold by
Allee Eric C
Bought by
Allee Eric J and Allee Lauren
Current Estimated Value
Purchase Details
Closed on
Sep 13, 1998
Sold by
Ruiz David E and Mitobe Larry
Bought by
Allee Eric J
Home Financials for this Owner
Home Financials are based on the most recent Mortgage that was taken out on this home.
Original Mortgage
$65,000
Interest Rate
6.61%
Mortgage Type
Stand Alone First
Purchase Details
Closed on
Apr 22, 1998
Sold by
David Chappell and David Cynthia
Bought by
Ruiz David E and Mitobe Larry
Purchase Details
Closed on
Jul 12, 1994
Sold by
Ruiz David E and Mitobe Larry
Bought by
Chappell David B and Chappell Cynthia K
Home Financials for this Owner
Home Financials are based on the most recent Mortgage that was taken out on this home.
Original Mortgage
$163,000
Interest Rate
8.57%
Mortgage Type
Seller Take Back
Create a Home Valuation Report for This Property
The Home Valuation Report is an in-depth analysis detailing your home's value as well as a comparison with similar homes in the area
Purchase History
| Date | Buyer | Sale Price | Title Company |
|---|---|---|---|
| Allee Eric J | -- | First American Title Ins Co | |
| Allee Eric J | $169,000 | First American Title Ins Co | |
| Ruiz David E | $164,705 | American Title Co | |
| Chappell David B | $169,000 | First American Title Ins Co |
Source: Public Records
Mortgage History
| Date | Status | Borrower | Loan Amount |
|---|---|---|---|
| Previous Owner | Allee Eric J | $65,000 | |
| Previous Owner | Chappell David B | $163,000 | |
| Closed | Allee Eric J | $45,000 |
Source: Public Records
Tax History
| Year | Tax Paid | Tax Assessment Tax Assessment Total Assessment is a certain percentage of the fair market value that is determined by local assessors to be the total taxable value of land and additions on the property. | Land | Improvement |
|---|---|---|---|---|
| 2025 | $3,088 | $264,929 | $161,555 | $103,374 |
| 2024 | $3,088 | $259,735 | $158,387 | $101,348 |
| 2023 | $3,010 | $254,643 | $155,282 | $99,361 |
| 2022 | $2,984 | $249,650 | $152,237 | $97,413 |
| 2021 | $2,932 | $244,755 | $149,252 | $95,503 |
| 2020 | $2,914 | $242,246 | $147,722 | $94,524 |
| 2019 | $2,842 | $237,497 | $144,826 | $92,671 |
| 2018 | $2,799 | $232,841 | $141,987 | $90,854 |
| 2017 | $2,751 | $228,276 | $139,203 | $89,073 |
| 2016 | $2,695 | $223,800 | $136,473 | $87,327 |
| 2015 | $2,621 | $220,439 | $134,423 | $86,016 |
| 2014 | $2,546 | $216,121 | $131,789 | $84,332 |
Source: Public Records
Map
Nearby Homes
- 1501 S Royer Ave
- 1207 W Woodcrest Ave
- 1360 Clementine Way
- 1935 W Clipper Ln Unit 50
- 1919 W Coronet Ave Unit 132
- 1919 W Coronet Ave Unit 75
- 1919 W Coronet Ave
- 1919 W Coronet Ave Unit 126
- 1919 W Coronet Ave Unit 190
- 1919 W Coronet Ave Unit 79
- 1975 W Ebbtide Way
- 1981 W Bayshore Dr
- 1510 W Orangethorpe Ave
- 2057 W Coronet Ave
- 1875 W Falmouth Ave Unit 58
- 1127 N Dresden St Unit 13
- 637 Liberation Way
- 2136 W Clover Ave
- 1409 W Dogwood Ave
- 461 W Roberta Ave
- 1518 S Lovering Ave
- 1530 S Lovering Ave
- 1519 S Citrus Ave
- 1525 S Citrus Ave
- 1513 S Citrus Ave
- 1525 S Lovering Ave
- 1533 S Lovering Ave
- 1507 S Citrus Ave
- 1539 S Lovering Ave
- 1506 S Lovering Ave
- 1513 S Lovering Ave
- 1501 S Citrus Ave
- 1124 W Houston Ave
- 1128 W Houston Ave
- 1120 W Houston Ave
- 1132 W Houston Ave
- 1524 S Royer Ave
- 1524 S Citrus Ave
- 1518 S Citrus Ave
- 1532 S Royer Ave
Your Personal Tour Guide
Ask me questions while you tour the home.