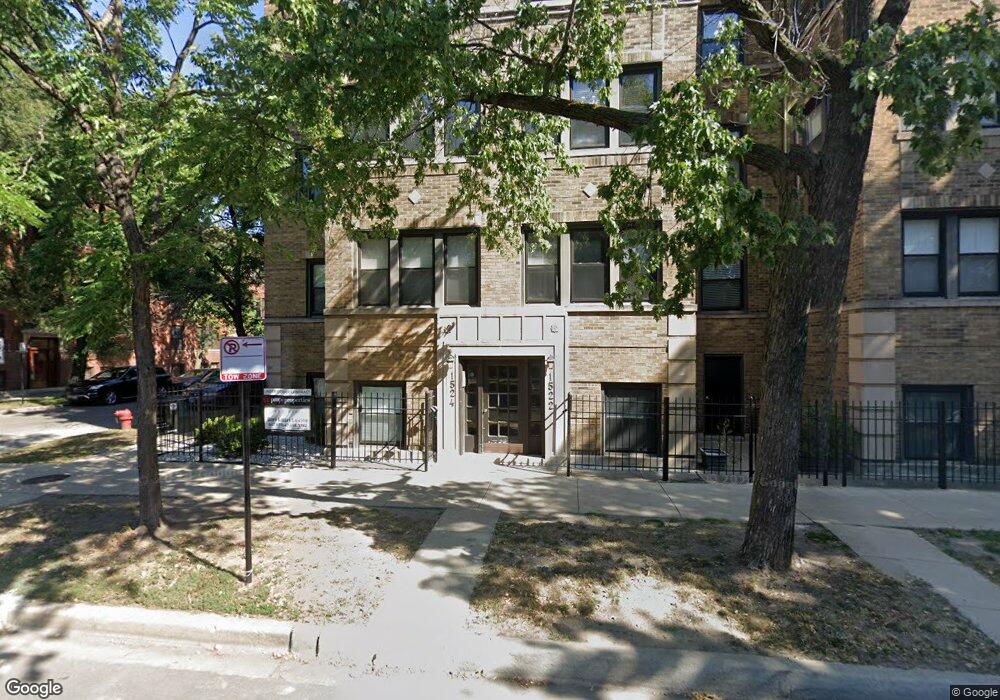
1524 W Addison St Unit 3 Chicago, IL 60613
Southport Corridor NeighborhoodEstimated Value: $374,000 - $516,000
2
Beds
2
Baths
--
Sq Ft
10,193
Sq Ft Lot
About This Home
This home is located at 1524 W Addison St Unit 3, Chicago, IL 60613 and is currently estimated at $454,379. 1524 W Addison St Unit 3 is a home located in Cook County with nearby schools including Blaine Elementary School, Lake View High School, and Saint Andrew School.
Ownership History
Date
Name
Owned For
Owner Type
Purchase Details
Closed on
Jul 17, 2017
Sold by
Tyson Rich and Nesterenko Karina
Bought by
Perille Karen
Current Estimated Value
Home Financials for this Owner
Home Financials are based on the most recent Mortgage that was taken out on this home.
Original Mortgage
$200,000
Outstanding Balance
$166,394
Interest Rate
3.94%
Mortgage Type
New Conventional
Estimated Equity
$287,985
Purchase Details
Closed on
May 19, 2010
Sold by
Ozbilge Megan Hein and Ozbilge Kerim
Bought by
Tyson Richard and Nesterenko Karina
Home Financials for this Owner
Home Financials are based on the most recent Mortgage that was taken out on this home.
Original Mortgage
$299,250
Interest Rate
5.12%
Mortgage Type
New Conventional
Purchase Details
Closed on
Dec 20, 2005
Sold by
3607 & 11 Bosworth Llc
Bought by
Hein Megan E
Home Financials for this Owner
Home Financials are based on the most recent Mortgage that was taken out on this home.
Original Mortgage
$271,900
Interest Rate
6.42%
Mortgage Type
Fannie Mae Freddie Mac
Create a Home Valuation Report for This Property
The Home Valuation Report is an in-depth analysis detailing your home's value as well as a comparison with similar homes in the area
Home Values in the Area
Average Home Value in this Area
Purchase History
| Date | Buyer | Sale Price | Title Company |
|---|---|---|---|
| Perille Karen | $320,000 | Ct | |
| Tyson Richard | $315,000 | Attorneys Title Guaranty Fun | |
| Hein Megan E | $340,000 | Near North National Title |
Source: Public Records
Mortgage History
| Date | Status | Borrower | Loan Amount |
|---|---|---|---|
| Open | Perille Karen | $200,000 | |
| Previous Owner | Tyson Richard | $299,250 | |
| Previous Owner | Hein Megan E | $271,900 |
Source: Public Records
Tax History Compared to Growth
Tax History
| Year | Tax Paid | Tax Assessment Tax Assessment Total Assessment is a certain percentage of the fair market value that is determined by local assessors to be the total taxable value of land and additions on the property. | Land | Improvement |
|---|---|---|---|---|
| 2024 | $5,980 | $33,629 | $8,203 | $25,426 |
| 2023 | $5,808 | $31,657 | $6,615 | $25,042 |
| 2022 | $5,808 | $31,657 | $6,615 | $25,042 |
| 2021 | $5,696 | $31,657 | $6,615 | $25,042 |
| 2020 | $5,477 | $27,688 | $2,822 | $24,866 |
| 2019 | $5,371 | $30,161 | $2,822 | $27,339 |
| 2018 | $5,958 | $30,161 | $2,822 | $27,339 |
| 2017 | $4,199 | $22,879 | $2,469 | $20,410 |
| 2016 | $4,082 | $22,879 | $2,469 | $20,410 |
| 2015 | $3,712 | $22,879 | $2,469 | $20,410 |
| 2014 | $4,019 | $24,232 | $2,017 | $22,215 |
| 2013 | $3,929 | $24,232 | $2,017 | $22,215 |
Source: Public Records
Map
Nearby Homes
- 3639 N Greenview Ave
- 3527 N Bosworth Ave
- 3644 N Bosworth Ave
- 3507 N Bosworth Ave
- 3509 N Janssen Ave
- 3719 N Bosworth Ave
- 3555 N Marshfield Ave Unit 1
- 3539 N Southport Ave Unit 2N
- 3708 N Southport Ave Unit 3
- 3735 N Greenview Ave
- 3732 N Janssen Ave Unit A
- 3448 N Ashland Ave Unit 2S
- 3752 N Janssen Ave
- 3438 N Ashland Ave Unit 2N
- 3422 N Bosworth Ave Unit 1
- 3434 N Southport Ave Unit 2
- 1440 W Roscoe St Unit 2
- 3814 N Greenview Ave Unit 1
- 7635 1/2 N Greenview Ave Unit 1S
- 3806 N Ashland Ave Unit 3N
- 3607 N Bosworth Ave Unit 1
- 1524 W Addison St Unit 2
- 3607 N Bosworth Ave Unit 36071
- 1522 W Addison St Unit 15221
- 3609 N Bosworth Ave Unit 36091
- 3609 N Bosworth Ave Unit 36093
- 1524 W Addison St Unit 1524G
- 3607 N Bosworth Ave Unit 36072
- 3607 N Bosworth Ave Unit 36073
- 1524 W Addison St Unit 15243
- 1524 W Addison St Unit 15241
- 3609 N Bosworth Ave Unit 36092
- 3607 N Bosworth Ave Unit 3607G
- 1524 W Addison St Unit 15242
- 1522 W Addison St Unit 15223
- 1522 W Addison St Unit 15222
- 1524 W Addison St
- 1522 W Addison St Unit 3
- 3607 N Bosworth Ave Unit 2
- 3609 N Bosworth Ave Unit 2