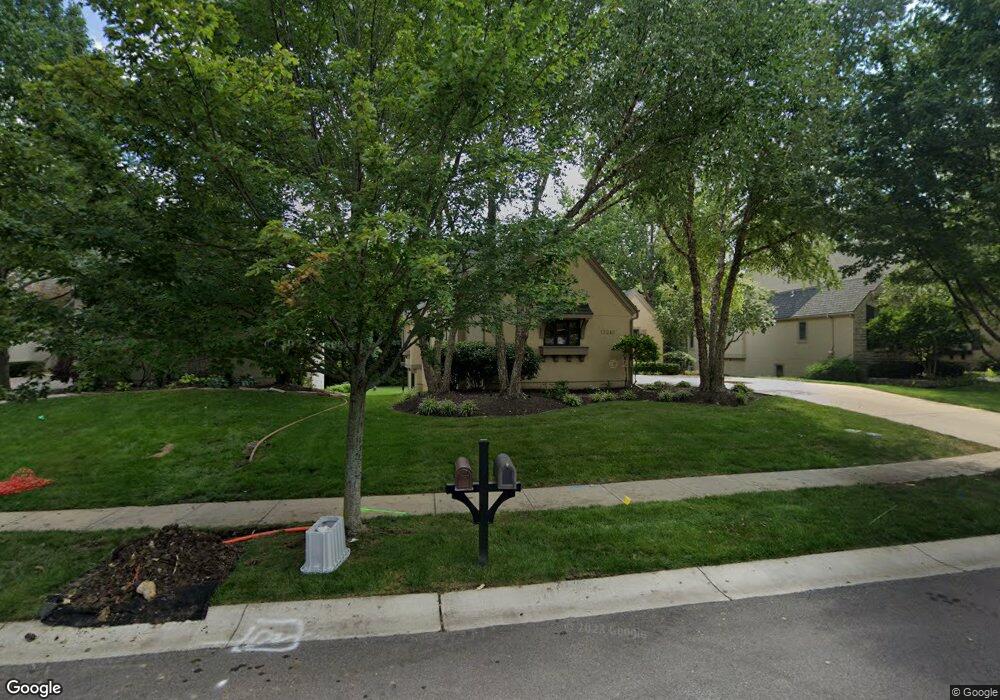
15240 Linden St Overland Park, KS 66224
Estimated Value: $822,834 - $912,000
4
Beds
4
Baths
2,219
Sq Ft
$390/Sq Ft
Est. Value
About This Home
This home is located at 15240 Linden St, Overland Park, KS 66224 and is currently estimated at $865,959, approximately $390 per square foot. 15240 Linden St is a home located in Johnson County with nearby schools including Sunrise Point Elementary School, Prairie Star Middle School, and Blue Valley High School.
Ownership History
Date
Name
Owned For
Owner Type
Purchase Details
Closed on
Jan 24, 2023
Sold by
Selph David A
Bought by
David A Selph Trust
Current Estimated Value
Purchase Details
Closed on
Dec 21, 2018
Sold by
Caine Brian and David A Selph Irrevocable Trus
Bought by
David A Selph Trust
Home Financials for this Owner
Home Financials are based on the most recent Mortgage that was taken out on this home.
Original Mortgage
$420,000
Interest Rate
4.9%
Mortgage Type
Credit Line Revolving
Purchase Details
Closed on
Sep 26, 2011
Sold by
Selph David A
Bought by
Selph David A and David A Selph Trust
Purchase Details
Closed on
Feb 20, 2002
Sold by
Ashner Construction Co Inc
Bought by
Selph David A
Home Financials for this Owner
Home Financials are based on the most recent Mortgage that was taken out on this home.
Original Mortgage
$459,150
Interest Rate
6.81%
Create a Home Valuation Report for This Property
The Home Valuation Report is an in-depth analysis detailing your home's value as well as a comparison with similar homes in the area
Home Values in the Area
Average Home Value in this Area
Purchase History
| Date | Buyer | Sale Price | Title Company |
|---|---|---|---|
| David A Selph Trust | -- | -- | |
| Selph David A | -- | -- | |
| David A Selph Trust | -- | First American Title | |
| Selph David A | -- | None Available | |
| Selph David A | -- | Security Land Title Company |
Source: Public Records
Mortgage History
| Date | Status | Borrower | Loan Amount |
|---|---|---|---|
| Previous Owner | David A Selph Trust | $420,000 | |
| Previous Owner | Selph David A | $459,150 |
Source: Public Records
Tax History Compared to Growth
Tax History
| Year | Tax Paid | Tax Assessment Tax Assessment Total Assessment is a certain percentage of the fair market value that is determined by local assessors to be the total taxable value of land and additions on the property. | Land | Improvement |
|---|---|---|---|---|
| 2024 | $9,409 | $84,260 | $16,478 | $67,782 |
| 2023 | $9,088 | $80,419 | $16,478 | $63,941 |
| 2022 | $8,014 | $69,483 | $16,478 | $53,005 |
| 2021 | $7,867 | $65,159 | $13,729 | $51,430 |
| 2020 | $8,550 | $69,356 | $20,593 | $48,763 |
| 2019 | $9,381 | $74,704 | $20,593 | $54,111 |
| 2018 | $9,888 | $77,303 | $24,347 | $52,956 |
| 2017 | $9,281 | $71,369 | $20,284 | $51,085 |
| 2016 | $8,501 | $65,470 | $16,903 | $48,567 |
| 2015 | $8,307 | $63,204 | $16,903 | $46,301 |
| 2013 | -- | $61,238 | $16,903 | $44,335 |
Source: Public Records
Map
Nearby Homes
- 15164 Sherwood St
- 4704 W 152nd St
- 15414 Iron Horse Cir
- 15457 Iron Horse Cir
- 15206 Catalina
- 15201 Catalina
- 15603 Linden Ln
- 14810 Sherwood St
- 5264 W 150th Terrace
- 15609 Linden St
- 5108 W 150th St
- 15619 Linden Ln
- 4405 157th St
- 5400 W 154th St
- 4466 W 150th Terrace
- 14913 Ash St
- 5408 W 154th St
- 15701 El Monte St
- 4421 W 150th St
- 15712 El Monte St
- 15244 Linden St
- 15232 Linden St
- 15248 Linden St
- 15237 Linden St
- 15249 Linden St
- 15229 Linden St
- 15228 Linden St
- 15241 Linden St
- 15219 Linden St
- 15245 Linden St
- 15224 Linden St
- 15232 Sherwood Rd
- 15232 Sherwood St
- 4709 W 152nd St
- 15209 Linden St
- 4713 W 152nd St
- 4705 W 152nd St
- 4717 W 152nd St
- 15220 Linden St
- 4721 W 152nd St