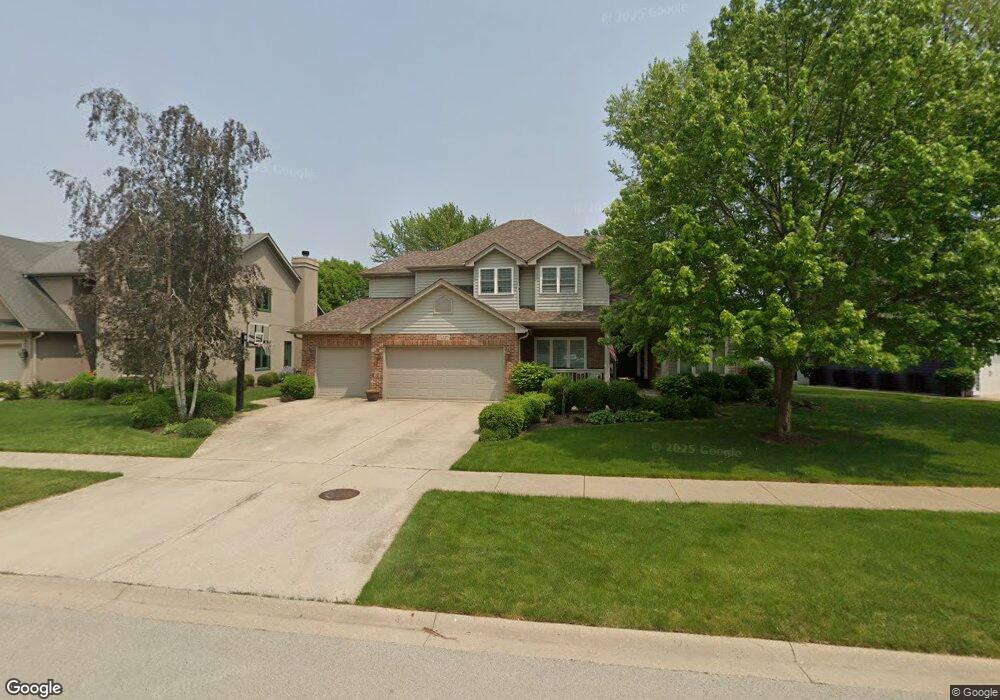
15249 Eyre Cir Plainfield, IL 60544
West Plainfield NeighborhoodEstimated Value: $510,314 - $646,000
Studio
1
Bath
2,721
Sq Ft
$213/Sq Ft
Est. Value
About This Home
This home is located at 15249 Eyre Cir, Plainfield, IL 60544 and is currently estimated at $579,829, approximately $213 per square foot. 15249 Eyre Cir is a home located in Will County with nearby schools including Richard Ira Jones Middle School, Plainfield North High School, and St Mary Immaculate Parish School.
Ownership History
Date
Name
Owned For
Owner Type
Purchase Details
Closed on
Apr 21, 2017
Sold by
Byczynski Brad J and Byczynski Lisa K
Bought by
The Byczynski Living Trust
Current Estimated Value
Purchase Details
Closed on
Nov 13, 1998
Sold by
Checkmate Custom Homes Inc
Bought by
Byczynski Brad J and Byczynski Lisa K
Home Financials for this Owner
Home Financials are based on the most recent Mortgage that was taken out on this home.
Original Mortgage
$184,921
Outstanding Balance
$40,364
Interest Rate
6.59%
Estimated Equity
$539,465
Purchase Details
Closed on
Aug 21, 1998
Sold by
The Macom Corp
Bought by
Checkmate Custom Homes Inc
Home Financials for this Owner
Home Financials are based on the most recent Mortgage that was taken out on this home.
Original Mortgage
$171,375
Interest Rate
8.5%
Mortgage Type
Construction
Create a Home Valuation Report for This Property
The Home Valuation Report is an in-depth analysis detailing your home's value as well as a comparison with similar homes in the area
Home Values in the Area
Average Home Value in this Area
Purchase History
| Date | Buyer | Sale Price | Title Company |
|---|---|---|---|
| The Byczynski Living Trust | -- | Attorney | |
| Byczynski Brad J | $225,000 | Chicago Title Insurance Co | |
| Checkmate Custom Homes Inc | $50,000 | First American Title |
Source: Public Records
Mortgage History
| Date | Status | Borrower | Loan Amount |
|---|---|---|---|
| Open | Byczynski Brad J | $184,921 | |
| Previous Owner | Checkmate Custom Homes Inc | $171,375 |
Source: Public Records
Tax History
| Year | Tax Paid | Tax Assessment Tax Assessment Total Assessment is a certain percentage of the fair market value that is determined by local assessors to be the total taxable value of land and additions on the property. | Land | Improvement |
|---|---|---|---|---|
| 2024 | $11,482 | $163,744 | $38,027 | $125,717 |
| 2023 | $11,482 | $147,890 | $34,345 | $113,545 |
| 2022 | $10,295 | $132,824 | $30,846 | $101,978 |
| 2021 | $9,726 | $124,135 | $28,828 | $95,307 |
| 2020 | $9,588 | $120,613 | $28,010 | $92,603 |
| 2019 | $9,816 | $121,565 | $26,689 | $94,876 |
| 2018 | $9,444 | $114,951 | $25,076 | $89,875 |
| 2017 | $9,155 | $109,238 | $23,830 | $85,408 |
| 2016 | $8,931 | $104,185 | $22,728 | $81,457 |
| 2015 | $8,448 | $97,597 | $21,291 | $76,306 |
| 2014 | $8,448 | $94,151 | $20,539 | $73,612 |
| 2013 | $8,448 | $94,151 | $20,539 | $73,612 |
Source: Public Records
Map
Nearby Homes
- 24701 Kingston St
- 15412 S James St
- 24914 W Illini Dr
- 15111 S Fox River St
- 24029 W Ottawa St
- 14946 S Mccarthy Cir
- 14938 S Mccarthy Cir
- 14951 S Dyer Ln
- 14912 S Henebry Ln
- 14920 S Henebry Ln
- 14926 S Henebry Ln
- 14933 S Dyer Ln
- 14844 S Henebry Ln
- 14956 S Mccarthy Cir
- 14940 S Mccarthy Cir
- 14908 S Henebry Ln
- 15058 S Darr Dr
- 000 Wood Farm Rd
- 25518 W Stockwell Dr
- 25500 W Alabaster Cir
- 15239 Eyre Cir
- 15261 Eyre Cir
- 15231 Eyre Cir
- 15238 Vetel Ct
- 15246 Vetel Ct Unit 1
- 15246 Eyre Cir
- 15240 Eyre Cir
- 15254 Eyre Cir
- 15264 Eyre Cir
- 15232 Eyre Cir Unit 1
- 15223 Eyre Cir
- 15226 Vetel Ct Unit 1
- 15228 Eyre Cir
- 15243 Hamlin St
- 15249 Hamlin St
- 15215 Eyre Cir
- 15235 Hamlin St
- 15224 Eyre Cir
- 15311 Hamlin St
- 15261 Hamlin St
Your Personal Tour Guide
Ask me questions while you tour the home.