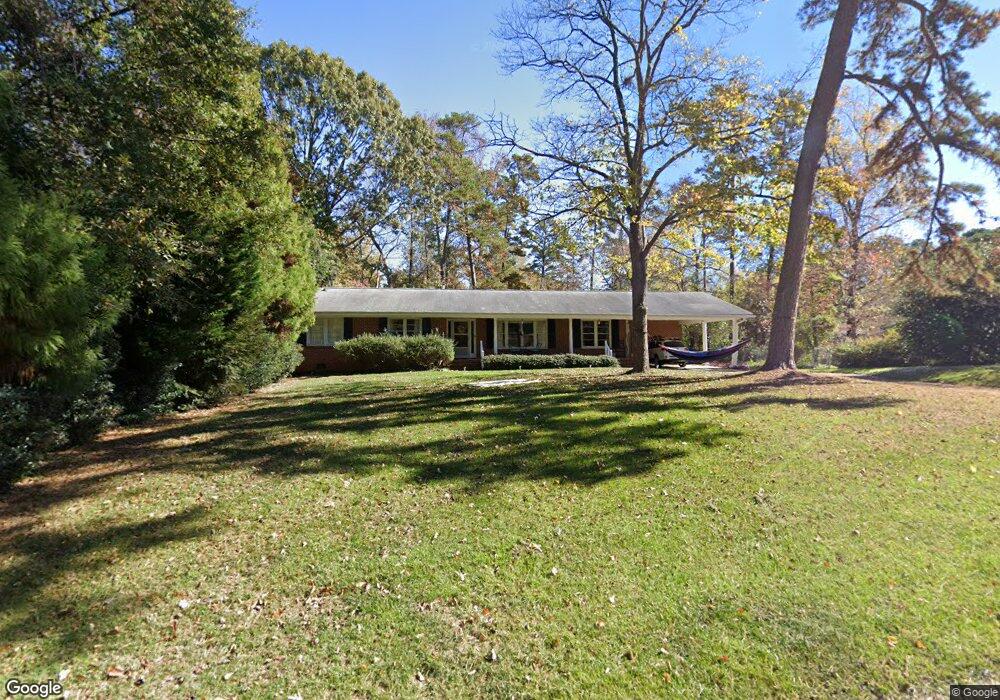
1525 Delmont Dr Raleigh, NC 27606
Avent West NeighborhoodEstimated Value: $477,254 - $568,000
3
Beds
2
Baths
1,768
Sq Ft
$287/Sq Ft
Est. Value
About This Home
This home is located at 1525 Delmont Dr, Raleigh, NC 27606 and is currently estimated at $507,814, approximately $287 per square foot. 1525 Delmont Dr is a home located in Wake County with nearby schools including A. B. Combs Magnet Elementary School, Centennial Campus Magnet Middle School, and Atlas International School.
Ownership History
Date
Name
Owned For
Owner Type
Purchase Details
Closed on
Aug 7, 2015
Sold by
Renn Robin D
Bought by
Renn Robin R
Current Estimated Value
Create a Home Valuation Report for This Property
The Home Valuation Report is an in-depth analysis detailing your home's value as well as a comparison with similar homes in the area
Home Values in the Area
Average Home Value in this Area
Purchase History
| Date | Buyer | Sale Price | Title Company |
|---|---|---|---|
| Renn Robin R | -- | Attorney |
Source: Public Records
Tax History Compared to Growth
Tax History
| Year | Tax Paid | Tax Assessment Tax Assessment Total Assessment is a certain percentage of the fair market value that is determined by local assessors to be the total taxable value of land and additions on the property. | Land | Improvement |
|---|---|---|---|---|
| 2025 | $4,077 | $465,241 | $215,000 | $250,241 |
| 2024 | $4,061 | $465,241 | $215,000 | $250,241 |
| 2023 | $3,324 | $303,125 | $120,000 | $183,125 |
| 2022 | $3,089 | $303,125 | $120,000 | $183,125 |
| 2021 | $2,969 | $303,125 | $120,000 | $183,125 |
| 2020 | $2,915 | $303,125 | $120,000 | $183,125 |
| 2019 | $2,762 | $236,628 | $90,000 | $146,628 |
| 2018 | $2,605 | $236,628 | $90,000 | $146,628 |
| 2017 | $2,482 | $236,628 | $90,000 | $146,628 |
| 2016 | $2,431 | $236,628 | $90,000 | $146,628 |
| 2015 | $2,457 | $235,340 | $90,000 | $145,340 |
| 2014 | $2,331 | $235,340 | $90,000 | $145,340 |
Source: Public Records
Map
Nearby Homes
- 4609 Kaplan Dr
- 1312 Onslow Rd
- 1208 Lorimer Rd
- 1277 Teakwood Place
- 1212 Schaub Dr Unit C
- 1208 Schaub Dr Unit B
- 1010 Sandlin Place Unit D
- 1008 Sandlin Place Unit J
- 1010 Sandlin Place Unit C
- 3916 Wendy Ln Unit 8B2
- 3952 Wendy Ln
- 5101 Wickham Rd
- 4350 Hunters Club Dr
- 1334 Kent Rd
- 713 Valerie Dr
- 4025 Greenleaf St
- 1115 Bayfield Dr
- 4258 Kaplan Dr
- 4242 Kaplan Dr
- 905 Deboy St
- 4712 Kaplan Dr
- 1514 Delmont Dr
- 1521 Delmont Dr
- 4708 Kaplan Dr
- 1515 Delmont Dr
- 4704 Kaplan Dr
- 1505 Delmont Dr
- 4800 Kaplan Dr
- 1524 Delmont Dr
- 1511 Delmont Dr
- 1522 Delmont Dr
- 4700 Kaplan Dr
- 1520 Delmont Dr
- 4804 Kaplan Dr
- 1518 Delmont Dr
- 1601 Sherburg Ct
- 1600 Sherburg Ct
- 1516 Delmont Dr
- 4705 Kaplan Dr
- 4801 Kaplan Dr