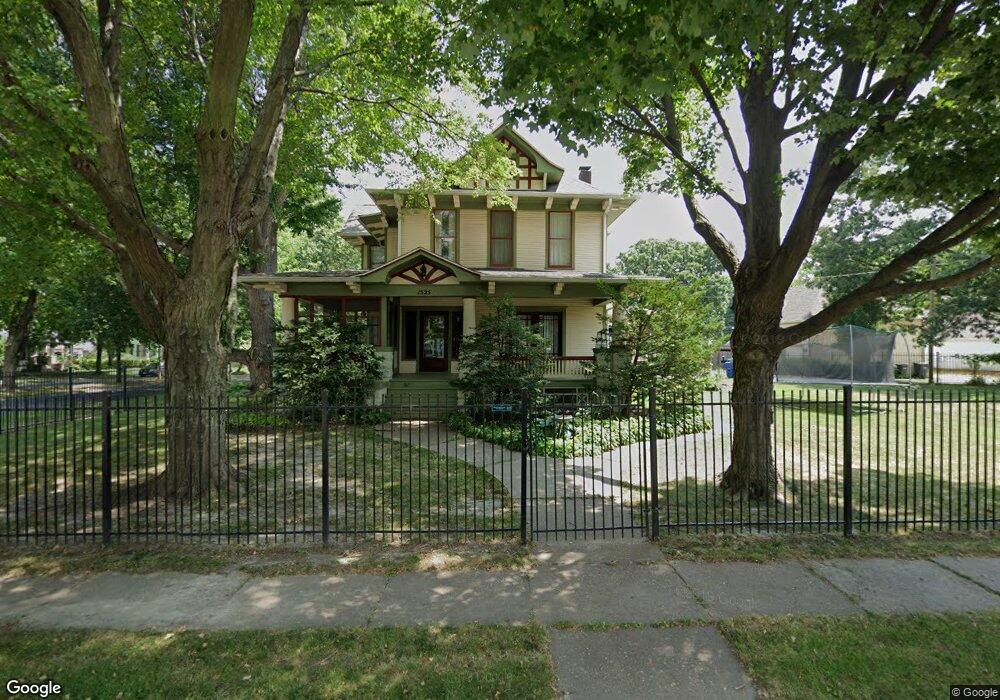
1525 Farnam St Davenport, IA 52803
Central Davenport NeighborhoodEstimated Value: $224,000 - $357,467
3
Beds
4
Baths
4,109
Sq Ft
$70/Sq Ft
Est. Value
About This Home
This home is located at 1525 Farnam St, Davenport, IA 52803 and is currently estimated at $289,617, approximately $70 per square foot. 1525 Farnam St is a home located in Scott County with nearby schools including Crofton Elementary School, Casey County Middle School, and Hopkinsville Middle School.
Ownership History
Date
Name
Owned For
Owner Type
Purchase Details
Closed on
Oct 7, 2022
Sold by
Nelson Ryan T and Nelson Rossana
Bought by
Ryan And Rossana Nelson Revocable Trust and Nelson
Current Estimated Value
Purchase Details
Closed on
Dec 15, 2010
Sold by
Peterschmidt Theodore R
Bought by
Nelson Ryan T and Nelson Rossana
Home Financials for this Owner
Home Financials are based on the most recent Mortgage that was taken out on this home.
Original Mortgage
$109,400
Interest Rate
4.22%
Mortgage Type
New Conventional
Purchase Details
Closed on
Jan 23, 2007
Sold by
Peterschmidt Kathleen J and Peterschmidt Kathleen J
Bought by
Peterschmidt Theodore R
Create a Home Valuation Report for This Property
The Home Valuation Report is an in-depth analysis detailing your home's value as well as a comparison with similar homes in the area
Home Values in the Area
Average Home Value in this Area
Purchase History
| Date | Buyer | Sale Price | Title Company |
|---|---|---|---|
| Ryan And Rossana Nelson Revocable Trust | -- | None Listed On Document | |
| Nelson Ryan T | $137,000 | None Available | |
| Peterschmidt Theodore R | -- | None Available |
Source: Public Records
Mortgage History
| Date | Status | Borrower | Loan Amount |
|---|---|---|---|
| Previous Owner | Nelson Ryan T | $109,400 |
Source: Public Records
Tax History Compared to Growth
Tax History
| Year | Tax Paid | Tax Assessment Tax Assessment Total Assessment is a certain percentage of the fair market value that is determined by local assessors to be the total taxable value of land and additions on the property. | Land | Improvement |
|---|---|---|---|---|
| 2025 | $5,138 | $297,740 | $42,980 | $254,760 |
| 2024 | $5,307 | $297,740 | $42,980 | $254,760 |
| 2023 | $5,651 | $297,740 | $42,980 | $254,760 |
| 2022 | $5,685 | $241,650 | $23,330 | $218,320 |
| 2021 | $4,994 | $241,650 | $23,330 | $218,320 |
| 2020 | $4,452 | $213,180 | $23,330 | $189,850 |
| 2019 | $4,606 | $213,770 | $23,330 | $190,440 |
| 2018 | $4,294 | $213,770 | $23,330 | $190,440 |
| 2017 | $1,136 | $204,230 | $23,330 | $180,900 |
| 2016 | $4,188 | $199,960 | $0 | $0 |
| 2015 | $4,188 | $197,140 | $0 | $0 |
| 2014 | $4,184 | $197,140 | $0 | $0 |
| 2013 | $4,108 | $0 | $0 | $0 |
| 2012 | -- | $219,290 | $32,760 | $186,530 |
Source: Public Records
Map
Nearby Homes
- 511 Kirkwood Blvd
- 637 E 15th St
- 618 Douglas Ct
- 420 Kirkwood Blvd
- 325 Kirkwood Blvd
- 409 E 14th St
- 407 E 14th St
- 320 E 14th St
- 1605 Arlington Ave
- 1215 Farnam St
- 916 Kirkwood Blvd
- 230 Kirkwood Blvd
- 1812 Pershing Ave
- 11 Oak Ln
- 1020 E 15th St
- 2024 Farnam St
- 625 E High St
- 2034 Farnam St
- 1222 Pershing Ave
- 209 E 13th St
- 617 Kirkwood Blvd
- 623 Kirkwood Blvd
- 1503 Farnam St
- 614 E 15th St
- 1530 Farnam St
- 625 Kirkwood Blvd
- 624 E 15th St
- 608 Kirkwood Blvd
- 604 Kirkwood Blvd
- 1510 Farnam St
- 633 Kirkwood Blvd
- 1604 Farnam St
- 1604 Farnam St Unit 2
- 1604 Farnam St Unit 1
- 1604 Farnam St
- 626 E 15th St
- 628 E 15th St
- 628 Kirkwood Blvd
- 510 E 15th St
- 637 Kirkwood Blvd