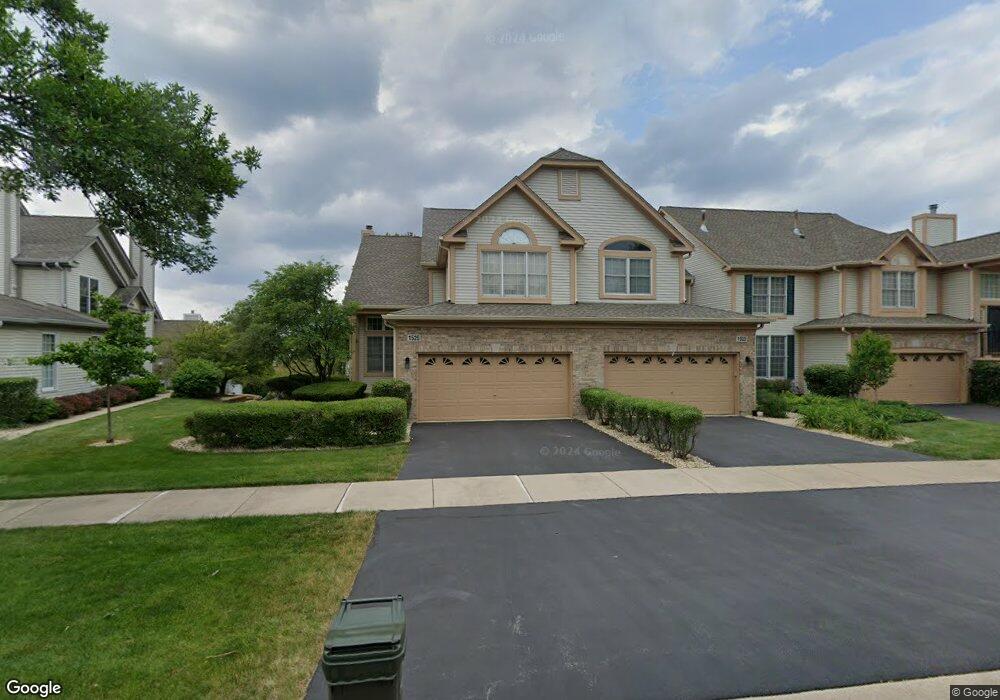
1525 Treeline Ct Unit 1101 Naperville, IL 60565
Meadow Glens NeighborhoodEstimated Value: $446,000 - $569,000
--
Bed
2
Baths
2,006
Sq Ft
$240/Sq Ft
Est. Value
About This Home
This home is located at 1525 Treeline Ct Unit 1101, Naperville, IL 60565 and is currently estimated at $481,720, approximately $240 per square foot. 1525 Treeline Ct Unit 1101 is a home located in DuPage County with nearby schools including Maplebrook Elementary School, Lincoln Jr. High School, and Naperville Central High School.
Ownership History
Date
Name
Owned For
Owner Type
Purchase Details
Closed on
Nov 16, 2016
Sold by
Guo Xiaohong
Bought by
Guo Xiaohong and Xiaohong Guo Trust
Current Estimated Value
Purchase Details
Closed on
Feb 7, 2005
Sold by
Lu Weidong
Bought by
Guo Xiaohong
Purchase Details
Closed on
Jul 26, 2002
Sold by
Dezonno Azra R
Bought by
Lu Weidong and Guo Xiao Hong
Home Financials for this Owner
Home Financials are based on the most recent Mortgage that was taken out on this home.
Original Mortgage
$150,000
Interest Rate
4.75%
Mortgage Type
Purchase Money Mortgage
Purchase Details
Closed on
Mar 27, 1998
Sold by
Wiseman Hughes Enterprises Inc
Bought by
Dezonno Azra R
Home Financials for this Owner
Home Financials are based on the most recent Mortgage that was taken out on this home.
Original Mortgage
$100,000
Interest Rate
7%
Mortgage Type
Purchase Money Mortgage
Create a Home Valuation Report for This Property
The Home Valuation Report is an in-depth analysis detailing your home's value as well as a comparison with similar homes in the area
Home Values in the Area
Average Home Value in this Area
Purchase History
| Date | Buyer | Sale Price | Title Company |
|---|---|---|---|
| Guo Xiaohong | -- | None Available | |
| Guo Xiaohong | -- | -- | |
| Lu Weidong | $290,000 | Law Title | |
| Dezonno Azra R | $245,000 | -- |
Source: Public Records
Mortgage History
| Date | Status | Borrower | Loan Amount |
|---|---|---|---|
| Previous Owner | Lu Weidong | $150,000 | |
| Previous Owner | Dezonno Azra R | $100,000 |
Source: Public Records
Tax History Compared to Growth
Tax History
| Year | Tax Paid | Tax Assessment Tax Assessment Total Assessment is a certain percentage of the fair market value that is determined by local assessors to be the total taxable value of land and additions on the property. | Land | Improvement |
|---|---|---|---|---|
| 2024 | $8,335 | $144,062 | $26,713 | $117,349 |
| 2023 | $8,024 | $131,480 | $24,380 | $107,100 |
| 2022 | $7,347 | $119,520 | $22,160 | $97,360 |
| 2021 | $7,075 | $115,000 | $21,320 | $93,680 |
| 2020 | $6,923 | $112,940 | $20,940 | $92,000 |
| 2019 | $6,717 | $108,050 | $20,030 | $88,020 |
| 2018 | $6,804 | $109,340 | $20,270 | $89,070 |
| 2017 | $6,664 | $105,660 | $19,590 | $86,070 |
| 2016 | $6,528 | $101,840 | $18,880 | $82,960 |
| 2015 | $6,480 | $95,900 | $17,780 | $78,120 |
| 2014 | $6,435 | $92,450 | $17,140 | $75,310 |
| 2013 | $6,338 | $92,670 | $17,180 | $75,490 |
Source: Public Records
Map
Nearby Homes
- 1449 Whitespire Ct Unit 5104
- 621 Bourbon Ct
- 158 E Bailey Rd Unit F
- 128 E Bailey Rd Unit G
- 138 E Bailey Rd Unit M
- 8S452 Bell Dr
- 1751 S Washington St Unit 1
- 517 Sheffield Rd
- 1408 Swallow St
- 1323 Auburn Ave
- 1340 Auburn Ave
- 302 Carriage Hill Rd
- 336 Brooklea Ct
- 1519 77th St
- 1921 Wisteria Ct Unit 3
- 213 Winding Creek Dr
- 816 Spindletree Ave
- 1704 Kenyon Dr
- 805 Potomac Ave
- 1216 Tranquility Ct
- 1523 Treeline Ct Unit 1102
- 1521 Treeline Ct Unit 1103
- 1531 Treeline Ct Unit 1005
- 1519 Treeline Ct Unit 1104
- 1533 Treeline Ct Unit 1004
- 1535 Treeline Ct Unit 1003
- 582 Harlowe Ln Unit 1403
- 576 Harlowe Ln Unit 1501
- 586 Harlowe Ln Unit 1401
- 574 Harlowe Ln Unit 1502
- 1537 Treeline Ct Unit 1002
- 572 Harlowe Ln Unit 1503
- 1532 Treeline Ct Unit 301
- 1526 Treeline Ct Unit 204
- 1511 Treeline Ct Unit 1202
- 1524 Treeline Ct Unit 203
- 1539 Treeline Ct Unit 1001
- 570 Harlowe Ln Unit 1504C
- 1522 Treeline Ct Unit 202
- 594 Harlowe Ln Unit 1303