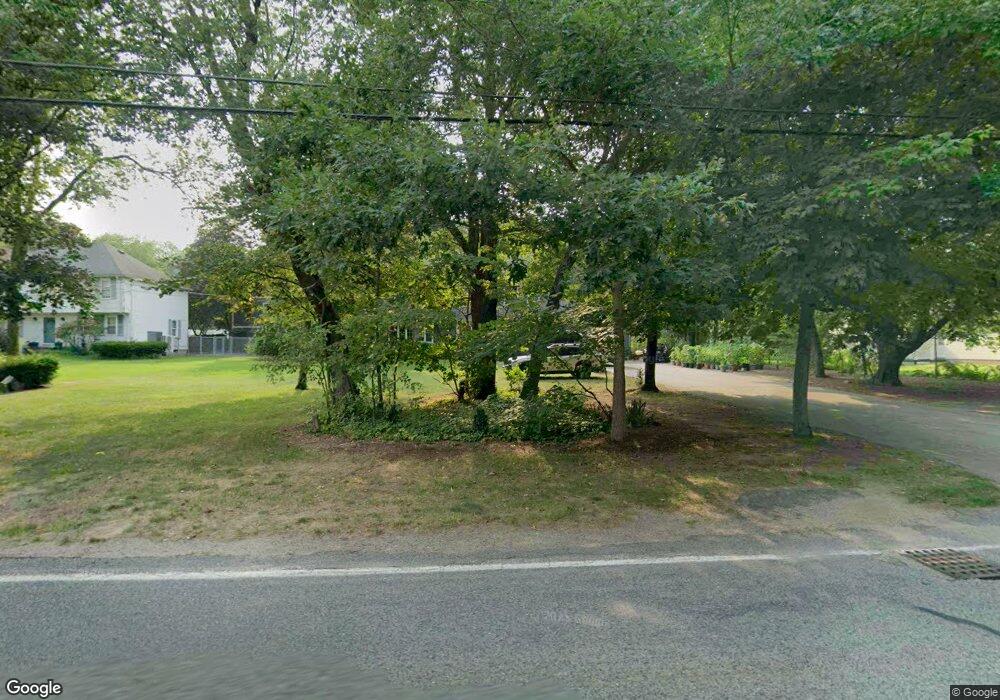
1525 West St Mansfield, MA 02048
Estimated Value: $699,000 - $905,000
4
Beds
3
Baths
1,800
Sq Ft
$425/Sq Ft
Est. Value
About This Home
This home is located at 1525 West St, Mansfield, MA 02048 and is currently estimated at $765,160, approximately $425 per square foot. 1525 West St is a home located in Bristol County with nearby schools including Everett W. Robinson Elementary School, Jordan/Jackson Elementary School, and Harold L. Qualters Middle School.
Ownership History
Date
Name
Owned For
Owner Type
Purchase Details
Closed on
Oct 26, 1995
Sold by
Brennan Robert H and Brennan Madeline M
Bought by
Lund Richard P and Lund Karen A
Current Estimated Value
Home Financials for this Owner
Home Financials are based on the most recent Mortgage that was taken out on this home.
Original Mortgage
$193,500
Interest Rate
7.6%
Mortgage Type
Purchase Money Mortgage
Create a Home Valuation Report for This Property
The Home Valuation Report is an in-depth analysis detailing your home's value as well as a comparison with similar homes in the area
Home Values in the Area
Average Home Value in this Area
Purchase History
| Date | Buyer | Sale Price | Title Company |
|---|---|---|---|
| Lund Richard P | $215,000 | -- |
Source: Public Records
Mortgage History
| Date | Status | Borrower | Loan Amount |
|---|---|---|---|
| Open | Lund Richard P | $175,000 | |
| Closed | Lund Richard P | $190,000 | |
| Closed | Lund Richard P | $193,500 | |
| Previous Owner | Lund Richard P | $153,000 |
Source: Public Records
Tax History Compared to Growth
Tax History
| Year | Tax Paid | Tax Assessment Tax Assessment Total Assessment is a certain percentage of the fair market value that is determined by local assessors to be the total taxable value of land and additions on the property. | Land | Improvement |
|---|---|---|---|---|
| 2025 | $8,431 | $640,200 | $241,800 | $398,400 |
| 2024 | $8,174 | $605,500 | $241,800 | $363,700 |
| 2023 | $7,885 | $559,600 | $241,800 | $317,800 |
| 2022 | $7,567 | $498,800 | $223,800 | $275,000 |
| 2021 | $7,580 | $493,500 | $195,900 | $297,600 |
| 2020 | $7,318 | $476,400 | $186,600 | $289,800 |
| 2019 | $6,816 | $447,800 | $155,400 | $292,400 |
| 2018 | $6,779 | $435,400 | $148,200 | $287,200 |
| 2017 | $6,358 | $423,300 | $144,000 | $279,300 |
| 2016 | $5,873 | $381,100 | $137,100 | $244,000 |
| 2015 | $5,715 | $368,700 | $137,100 | $231,600 |
Source: Public Records
Map
Nearby Homes
- 1730 West St
- 56 Jacob Dr
- 47 Old Farm Rd
- 17 Peters Way
- 122 Mary Ann Way
- 36 Cranberry Rd
- 14 Claire Ave
- 116 George St
- 1125 School St
- 11 Landry Ave
- 16 Raymond Hall Dr
- 10 Sleepy Hollow Cir
- 33 Treasure Island Rd
- 24 Red Coat Ln
- 16 Treasure Island Rd
- 115 Westfield Dr
- 15 Old Wood Rd
- 57 Vine St
- 6 Colts Way
- 33 Dublin Way