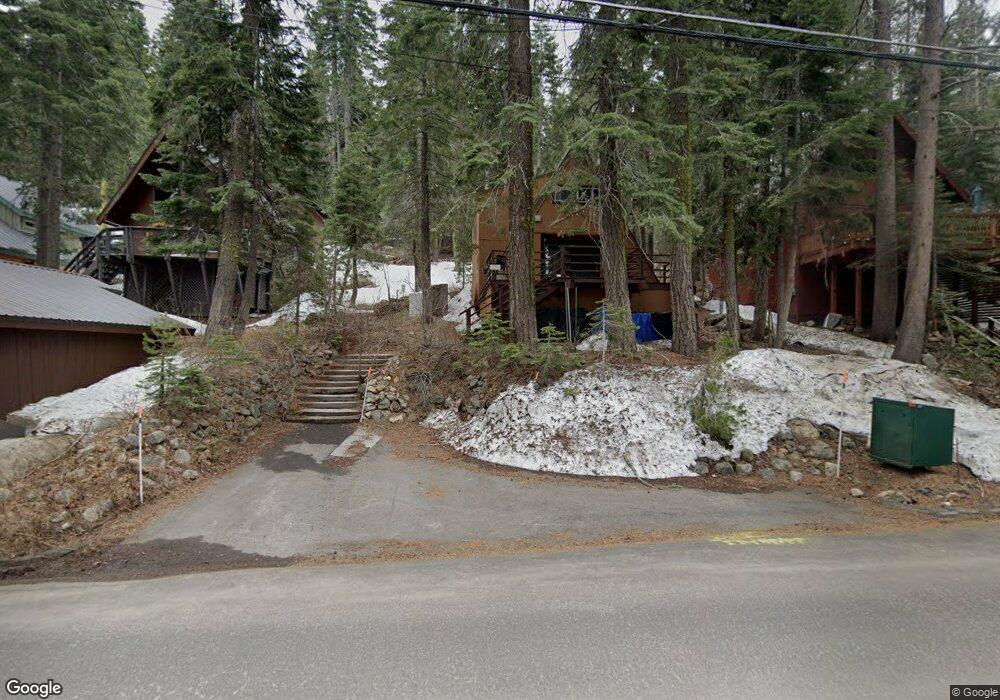
15251 S Shore Dr Truckee, CA 96161
South Truckee NeighborhoodEstimated Value: $633,000 - $890,000
2
Beds
2
Baths
1,254
Sq Ft
$597/Sq Ft
Est. Value
About This Home
This home is located at 15251 S Shore Dr, Truckee, CA 96161 and is currently estimated at $748,033, approximately $596 per square foot. 15251 S Shore Dr is a home located in Placer County with nearby schools including Truckee Elementary School, Alder Creek Middle School, and Tahoe Truckee High School.
Ownership History
Date
Name
Owned For
Owner Type
Purchase Details
Closed on
Jan 1, 2018
Sold by
Peltier Bruce N and Pomeroy Tracey
Bought by
Edwards Christopher and Edwards Anjuli
Current Estimated Value
Home Financials for this Owner
Home Financials are based on the most recent Mortgage that was taken out on this home.
Original Mortgage
$358,400
Interest Rate
4.6%
Mortgage Type
New Conventional
Purchase Details
Closed on
Jan 6, 2005
Sold by
Seiki Osamu Sam and Seiki Yukiko A
Bought by
Peltier Bruce N and Pomeroy Tracey
Home Financials for this Owner
Home Financials are based on the most recent Mortgage that was taken out on this home.
Original Mortgage
$292,500
Interest Rate
5.8%
Mortgage Type
Unknown
Purchase Details
Closed on
Feb 9, 1994
Sold by
Seiki Osamu Sam and Seiki Yukiko
Bought by
Seiki Osamu Sam and Seiki Yukiko A
Create a Home Valuation Report for This Property
The Home Valuation Report is an in-depth analysis detailing your home's value as well as a comparison with similar homes in the area
Home Values in the Area
Average Home Value in this Area
Purchase History
| Date | Buyer | Sale Price | Title Company |
|---|---|---|---|
| Edwards Christopher | $448,000 | First American Title Co | |
| Peltier Bruce N | $382,500 | First American Title | |
| Seiki Osamu Sam | -- | -- |
Source: Public Records
Mortgage History
| Date | Status | Borrower | Loan Amount |
|---|---|---|---|
| Previous Owner | Edwards Christopher | $358,400 | |
| Previous Owner | Peltier Bruce N | $292,500 |
Source: Public Records
Tax History Compared to Growth
Tax History
| Year | Tax Paid | Tax Assessment Tax Assessment Total Assessment is a certain percentage of the fair market value that is determined by local assessors to be the total taxable value of land and additions on the property. | Land | Improvement |
|---|---|---|---|---|
| 2025 | $6,347 | $499,747 | $150,592 | $349,155 |
| 2023 | $6,347 | $480,344 | $144,746 | $335,598 |
| 2022 | $6,099 | $470,926 | $141,908 | $329,018 |
| 2021 | $5,694 | $461,693 | $139,126 | $322,567 |
| 2020 | $6,228 | $456,960 | $137,700 | $319,260 |
| 2019 | $6,578 | $477,948 | $334,255 | $143,693 |
| 2018 | $6,056 | $468,577 | $327,701 | $140,876 |
| 2017 | $5,961 | $459,390 | $321,276 | $138,114 |
| 2016 | $5,920 | $450,383 | $314,977 | $135,406 |
| 2015 | $5,798 | $443,619 | $310,246 | $133,373 |
| 2014 | $4,184 | $305,000 | $195,000 | $110,000 |
Source: Public Records
Map
Nearby Homes
- 10735 Dogwood St
- 10580 Cedar Dr
- 14821 Mount Judah Dr
- 14704 Mt Judah Dr
- 15897 S Shore Dr
- 10547 Donner Lake Rd
- 10515 Donner Lake Rd
- 10575 Donner Lake Rd
- 10607 Donner Lake Rd
- 14395 S Shore Dr
- 14740 Denton Ave
- 14580 Denton Ave
- 14515 Denton Ave
- 14741 Denton Ave
- 14161 Tanager Ln
- 10134 Michael's Way
- 8600 Cold Stream Rd
- 13500 Donner Pass Rd
- 15009 Ski Slope Way
- 13464 Moraine Rd
- 15241 S Shore Dr
- 15231 S Shore Dr
- 15261 S Shore Dr
- 15270 S Shore Dr
- 15280 S Shore Dr
- 15244 S Shore Dr
- 15290 S Shore Dr
- 15281 S Shore Dr
- 15224 S Shore Dr
- 15300 S Shore Dr
- 15291 S Shore Dr
- 15310 S Shore Dr
- 15212 Point Dr
- 15311 S Shore Dr
- 15208 Point Dr
- 15260 S Shore Dr
- 15321 S Shore Dr
- 15336 S Shore Dr
- 15320 S Shore Dr
- 15206 Point Dr