
Seller's Agent in 2025
Kari Stone
RE/MAX
(515) 402-7066
4 in this area
37 Total Sales
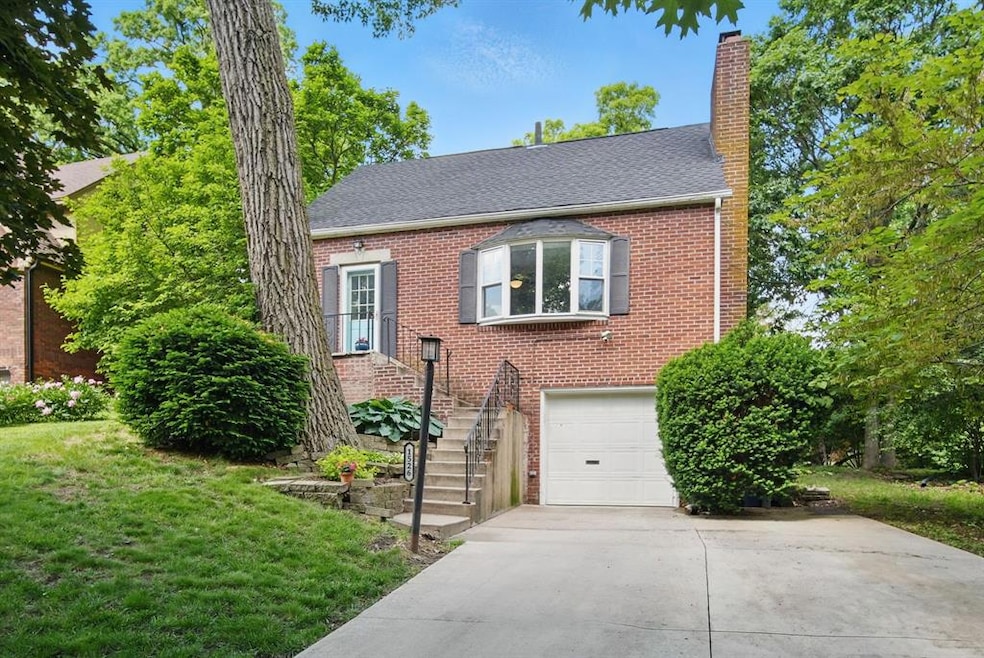
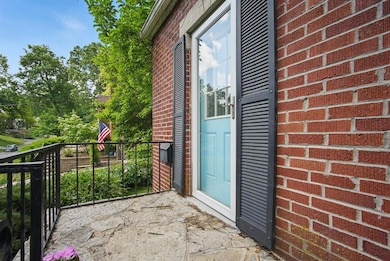
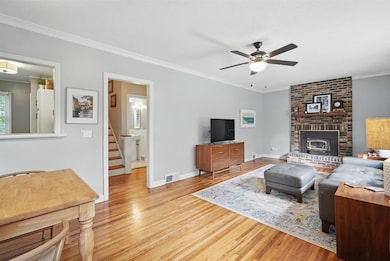
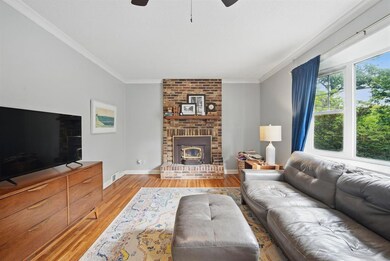
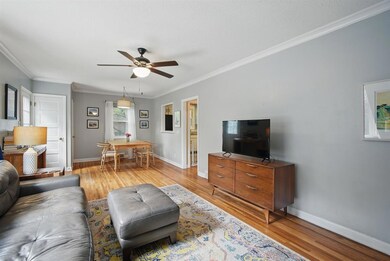
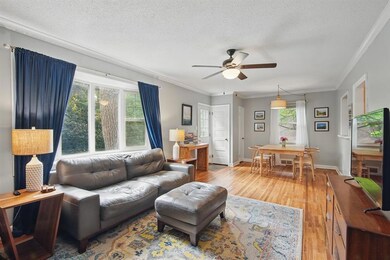
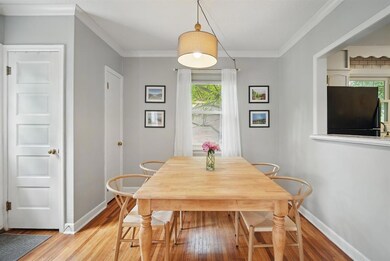
Welcome to this classic Beaverdale brick home nestled on a picturesque street. Enjoy the original charm with beautiful hardwood floors and a cozy brick fireplace anchoring the living and dining areas. The updated kitchen features painted cabinets, new countertops, and a classic backsplash. One bedroom and a 1/2 bathroom reside on the main floor while upstairs offers two more spacious bedrooms, continued hardwood flooring, and a fully remodeled bathroom.
Major updates include a new roof (2022), sump pump (2024), hot water heater (2021), and concrete driveway (2020). Enjoy peaceful mornings in the 3-season porch overlooking a large backyard with wildlife visitors and an extra storage shed. Conveniently located near Perkins Elementary and minutes from I-235! This home is in the heart of it all!
All information obtained from seller and public records.
| Date | Type | Sale Price | Title Company |
|---|---|---|---|
| Warranty Deed | $265,000 | None Listed On Document | |
| Warranty Deed | $265,000 | None Listed On Document | |
| Warranty Deed | $182,000 | None Available | |
| Warranty Deed | $139,000 | Itc | |
| Warranty Deed | $124,500 | None Available |
| Date | Status | Loan Amount | Loan Type |
|---|---|---|---|
| Open | $205,000 | New Conventional | |
| Closed | $205,000 | New Conventional | |
| Previous Owner | $89,500 | New Conventional |
| Date | Event | Price | List to Sale | Price per Sq Ft |
|---|---|---|---|---|
| 07/16/2025 07/16/25 | Sold | $265,000 | +2.3% | $195 / Sq Ft |
| 06/09/2025 06/09/25 | Pending | -- | -- | -- |
| 06/05/2025 06/05/25 | For Sale | $259,000 | -- | $191 / Sq Ft |
| Year | Tax Paid | Tax Assessment Tax Assessment Total Assessment is a certain percentage of the fair market value that is determined by local assessors to be the total taxable value of land and additions on the property. | Land | Improvement |
|---|---|---|---|---|
| 2025 | $4,346 | $249,700 | $50,400 | $199,300 |
| 2024 | $4,346 | $231,400 | $45,400 | $186,000 |
| 2023 | $4,518 | $231,400 | $45,400 | $186,000 |
| 2022 | $4,482 | $200,600 | $40,100 | $160,500 |
| 2021 | $4,392 | $200,600 | $40,100 | $160,500 |
| 2020 | $4,558 | $184,600 | $36,700 | $147,900 |
| 2019 | $4,286 | $184,600 | $36,700 | $147,900 |
| 2018 | $4,238 | $168,000 | $32,600 | $135,400 |
| 2017 | $3,814 | $168,000 | $32,600 | $135,400 |
| 2016 | $3,710 | $149,500 | $28,600 | $120,900 |
| 2015 | $3,710 | $149,500 | $28,600 | $120,900 |
| 2014 | $3,472 | $139,400 | $26,100 | $113,300 |
Seller's Agent in 2025
Kari Stone
RE/MAX
(515) 402-7066
4 in this area
37 Total Sales
Seller Co-Listing Agent in 2025
Sara Hopkins
RE/MAX
(515) 710-6030
25 in this area
605 Total Sales
Buyer's Agent in 2025
Kate Carlson
Realty ONE Group Impact
(515) 313-5054
2 in this area
121 Total Sales
Source: Des Moines Area Association of REALTORS®
MLS Number: 719602
APN: 100-04501000000
Disclaimer: Certain information contained herein is derived from information provided by parties other than Homes.com. All information provided is deemed reliable, but is not guaranteed to be accurate and should be independently verified.
![]() IDX information is provided exclusively for personal, non-commercial use, and may not be used for any purpose other than to identify prospective properties consumers may be interested in purchasing. Information is deemed reliable but not guaranteed.
IDX information is provided exclusively for personal, non-commercial use, and may not be used for any purpose other than to identify prospective properties consumers may be interested in purchasing. Information is deemed reliable but not guaranteed.