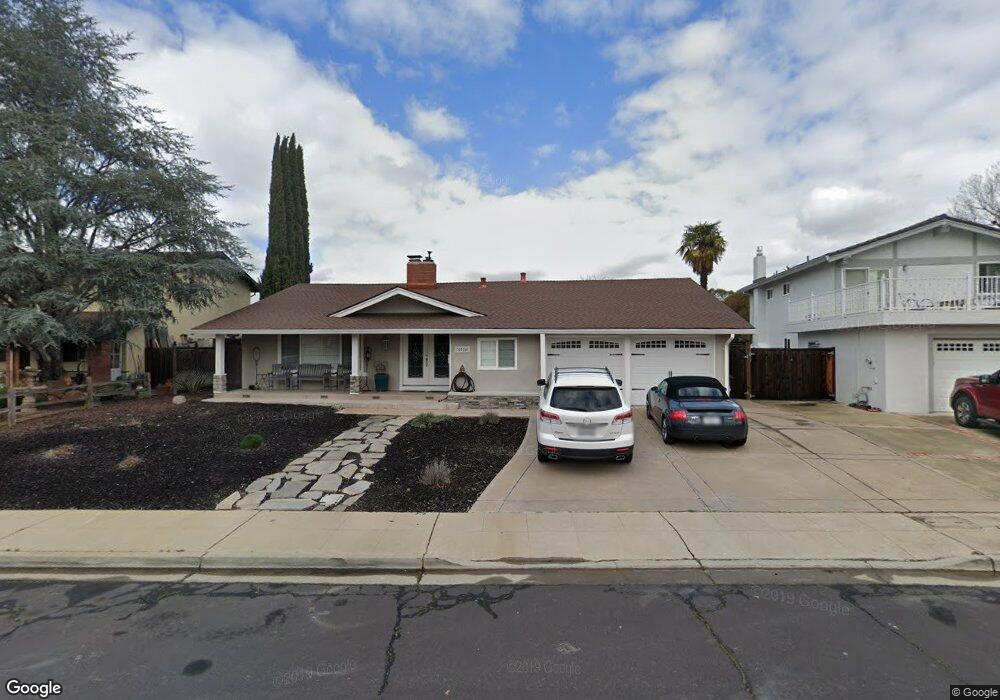
1526 De Soto Way Livermore, CA 94550
Sunset East NeighborhoodEstimated Value: $1,286,073 - $1,466,000
4
Beds
2
Baths
2,024
Sq Ft
$683/Sq Ft
Est. Value
About This Home
This home is located at 1526 De Soto Way, Livermore, CA 94550 and is currently estimated at $1,381,518, approximately $682 per square foot. 1526 De Soto Way is a home located in Alameda County with nearby schools including William Mendenhall Middle School, Granada High School, and St Michael's School.
Ownership History
Date
Name
Owned For
Owner Type
Purchase Details
Closed on
Aug 10, 1999
Sold by
Eichhorn Edgar G and Eichhorn Ruth A
Bought by
Brandt Randall E and Brandt Lynda M
Current Estimated Value
Home Financials for this Owner
Home Financials are based on the most recent Mortgage that was taken out on this home.
Original Mortgage
$303,862
Outstanding Balance
$66,555
Interest Rate
4.55%
Estimated Equity
$1,314,963
Purchase Details
Closed on
Mar 4, 1994
Sold by
Eichhorn Edgar G and Eichhorn Edgar O
Bought by
Eichhorn Edgar G and Eichhorn Ruth Ann
Home Financials for this Owner
Home Financials are based on the most recent Mortgage that was taken out on this home.
Original Mortgage
$96,000
Interest Rate
7%
Create a Home Valuation Report for This Property
The Home Valuation Report is an in-depth analysis detailing your home's value as well as a comparison with similar homes in the area
Home Values in the Area
Average Home Value in this Area
Purchase History
| Date | Buyer | Sale Price | Title Company |
|---|---|---|---|
| Brandt Randall E | $338,000 | Chicago Title Co | |
| Eichhorn Edgar G | -- | First American Title |
Source: Public Records
Mortgage History
| Date | Status | Borrower | Loan Amount |
|---|---|---|---|
| Open | Brandt Randall E | $303,862 | |
| Previous Owner | Eichhorn Edgar G | $96,000 |
Source: Public Records
Tax History Compared to Growth
Tax History
| Year | Tax Paid | Tax Assessment Tax Assessment Total Assessment is a certain percentage of the fair market value that is determined by local assessors to be the total taxable value of land and additions on the property. | Land | Improvement |
|---|---|---|---|---|
| 2025 | $7,212 | $545,058 | $155,840 | $389,218 |
| 2024 | $7,212 | $534,373 | $152,785 | $381,588 |
| 2023 | $7,100 | $523,897 | $149,790 | $374,107 |
| 2022 | $6,993 | $513,626 | $146,853 | $366,773 |
| 2021 | $6,106 | $503,557 | $143,974 | $359,583 |
| 2020 | $6,645 | $498,397 | $142,499 | $355,898 |
| 2019 | $6,670 | $488,626 | $139,705 | $348,921 |
| 2018 | $6,524 | $479,048 | $136,967 | $342,081 |
| 2017 | $6,354 | $469,656 | $134,281 | $335,375 |
| 2016 | $6,116 | $460,449 | $131,649 | $328,800 |
| 2015 | $5,742 | $453,534 | $129,672 | $323,862 |
| 2014 | $5,642 | $444,650 | $127,132 | $317,518 |
Source: Public Records
Map
Nearby Homes
- 1467 Hudson Way
- 1307 Belfast Ct
- 528 S S St
- 2215 Chardonnay Way
- 1087 Murrieta Blvd Unit 243
- 1087 Murrieta Blvd Unit 138
- 1087 Murrieta Blvd Unit 245
- 1087 Murrieta Blvd Unit 242
- 589 S M St
- 1085 Murrieta Blvd Unit 318
- 1085 Murrieta Blvd Unit 222
- 2203 Sherry Ct
- 1727 2nd St
- 1153 Sherry Way
- 2235 4th St
- 2772 San Minete Dr
- 628 Lido Dr
- 905 S Livermore Ave
- 1320 Ventura Ave
- 1948 Railroad Ave Unit 104
- 1518 De Soto Way
- 1530 De Soto Way
- 1510 De Soto Way
- 1538 De Soto Way
- 1529 De Soto Way
- 1521 De Soto Way
- 1130 Florence Rd
- 1542 De Soto Way
- 1531 De Leon Way
- 1537 De Soto Way
- 1138 Florence Rd
- 1127 Florence Rd
- 1550 De Soto Way
- 1113 Florence Rd
- 1541 De Soto Way
- 1131 Florence Rd
- 1539 De Leon Way
- 1146 Florence Rd
- 1107 Florence Rd
- 1558 De Leon Way