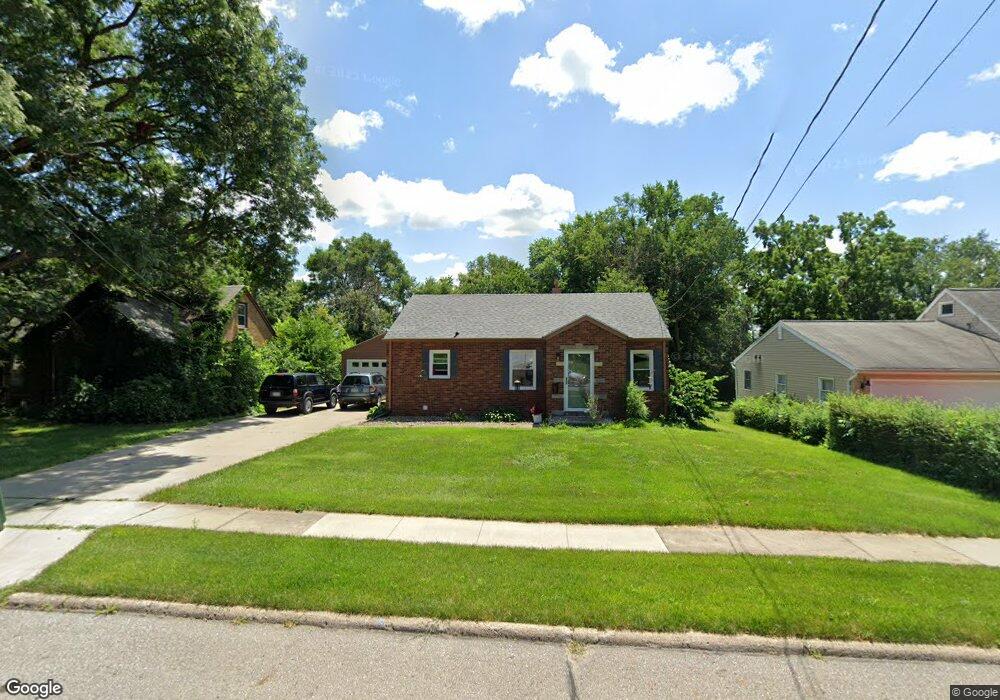
1526 Locust St West Des Moines, IA 50265
Estimated Value: $253,000 - $327,000
3
Beds
2
Baths
884
Sq Ft
$317/Sq Ft
Est. Value
About This Home
This home is located at 1526 Locust St, West Des Moines, IA 50265 and is currently estimated at $280,102, approximately $316 per square foot. 1526 Locust St is a home located in Polk County with nearby schools including Hillside Elementary School, Stilwell Junior High School, and Valley Southwoods Freshman High School.
Ownership History
Date
Name
Owned For
Owner Type
Purchase Details
Closed on
Apr 20, 2018
Sold by
Bsk Properties Llc
Bought by
Utoft Deborah
Current Estimated Value
Home Financials for this Owner
Home Financials are based on the most recent Mortgage that was taken out on this home.
Original Mortgage
$189,050
Outstanding Balance
$162,655
Interest Rate
4.46%
Mortgage Type
New Conventional
Estimated Equity
$117,447
Purchase Details
Closed on
Nov 16, 2017
Sold by
Dudley Nathan A and United States Of America
Bought by
Bsk Properties L L C
Purchase Details
Closed on
Apr 4, 2009
Sold by
Hatfield Scott A and Hatfield Diana J
Bought by
Dudley Nathan
Home Financials for this Owner
Home Financials are based on the most recent Mortgage that was taken out on this home.
Original Mortgage
$132,554
Interest Rate
5.05%
Mortgage Type
FHA
Purchase Details
Closed on
Nov 9, 2003
Sold by
Hatfield Freeman and Hatfield Freeman S
Bought by
Hatfield Scott A
Create a Home Valuation Report for This Property
The Home Valuation Report is an in-depth analysis detailing your home's value as well as a comparison with similar homes in the area
Home Values in the Area
Average Home Value in this Area
Purchase History
| Date | Buyer | Sale Price | Title Company |
|---|---|---|---|
| Utoft Deborah | $199,000 | None Available | |
| Bsk Properties L L C | $100,000 | None Available | |
| Dudley Nathan | $134,500 | None Available | |
| Hatfield Scott A | -- | -- |
Source: Public Records
Mortgage History
| Date | Status | Borrower | Loan Amount |
|---|---|---|---|
| Open | Utoft Deborah | $189,050 | |
| Previous Owner | Dudley Nathan | $132,554 |
Source: Public Records
Tax History Compared to Growth
Tax History
| Year | Tax Paid | Tax Assessment Tax Assessment Total Assessment is a certain percentage of the fair market value that is determined by local assessors to be the total taxable value of land and additions on the property. | Land | Improvement |
|---|---|---|---|---|
| 2025 | $4,202 | $290,700 | $75,500 | $215,200 |
| 2024 | $4,202 | $265,100 | $68,800 | $196,300 |
| 2023 | $4,286 | $265,100 | $68,800 | $196,300 |
| 2022 | $4,236 | $222,000 | $59,300 | $162,700 |
| 2021 | $4,056 | $222,000 | $59,300 | $162,700 |
| 2020 | $3,996 | $202,300 | $54,000 | $148,300 |
| 2019 | $3,694 | $202,300 | $54,000 | $148,300 |
| 2018 | $2,774 | $180,300 | $47,300 | $133,000 |
| 2017 | $2,642 | $143,800 | $47,300 | $96,500 |
| 2016 | $2,580 | $133,500 | $43,400 | $90,100 |
| 2015 | $2,580 | $133,500 | $43,400 | $90,100 |
| 2014 | $2,408 | $127,700 | $40,800 | $86,900 |
Source: Public Records
Map
Nearby Homes