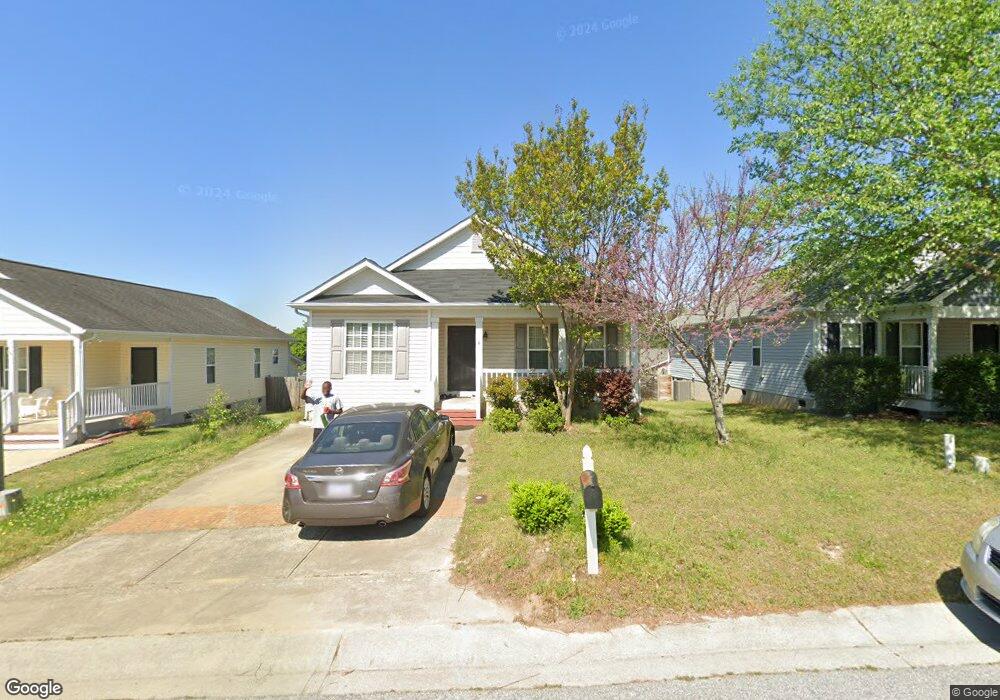
1526 Mark Massengill Dr Raleigh, NC 27610
Walnut Creek NeighborhoodEstimated Value: $272,000 - $296,000
--
Bed
2
Baths
1,255
Sq Ft
$226/Sq Ft
Est. Value
About This Home
This home is located at 1526 Mark Massengill Dr, Raleigh, NC 27610 and is currently estimated at $283,532, approximately $225 per square foot. 1526 Mark Massengill Dr is a home located in Wake County with nearby schools including Rogers Lane Elementary, Carnage Magnet Middle School, and South Garner High.
Ownership History
Date
Name
Owned For
Owner Type
Purchase Details
Closed on
Nov 14, 2006
Sold by
Habitat For Humanity Of Wake County Inc
Bought by
Keyunga Tabu and Holibi Medju
Current Estimated Value
Home Financials for this Owner
Home Financials are based on the most recent Mortgage that was taken out on this home.
Original Mortgage
$20,000
Outstanding Balance
$1,969
Interest Rate
6.25%
Mortgage Type
Unknown
Estimated Equity
$281,563
Create a Home Valuation Report for This Property
The Home Valuation Report is an in-depth analysis detailing your home's value as well as a comparison with similar homes in the area
Home Values in the Area
Average Home Value in this Area
Purchase History
| Date | Buyer | Sale Price | Title Company |
|---|---|---|---|
| Keyunga Tabu | $119,000 | None Available |
Source: Public Records
Mortgage History
| Date | Status | Borrower | Loan Amount |
|---|---|---|---|
| Open | Keyunga Tabu | $20,000 | |
| Open | Keyunga Tabu | $97,550 |
Source: Public Records
Tax History Compared to Growth
Tax History
| Year | Tax Paid | Tax Assessment Tax Assessment Total Assessment is a certain percentage of the fair market value that is determined by local assessors to be the total taxable value of land and additions on the property. | Land | Improvement |
|---|---|---|---|---|
| 2025 | $2,432 | $276,565 | $70,000 | $206,565 |
| 2024 | $2,422 | $276,565 | $70,000 | $206,565 |
| 2023 | $1,675 | $151,798 | $30,000 | $121,798 |
| 2022 | $1,557 | $151,798 | $30,000 | $121,798 |
| 2021 | $1,497 | $151,798 | $30,000 | $121,798 |
| 2020 | $1,470 | $151,798 | $30,000 | $121,798 |
| 2019 | $1,366 | $116,132 | $25,000 | $91,132 |
| 2018 | $1,289 | $116,132 | $25,000 | $91,132 |
| 2017 | $1,228 | $116,132 | $25,000 | $91,132 |
| 2016 | $1,203 | $116,132 | $25,000 | $91,132 |
| 2015 | $1,405 | $133,732 | $38,000 | $95,732 |
| 2014 | $1,333 | $133,732 | $38,000 | $95,732 |
Source: Public Records
Map
Nearby Homes
- 1545 Tom Gipson Dr
- 6041 Sodium St
- 403 Sustainable Way
- 3805 Mike Levi Ct
- 3816 Mike Levi Ct
- 4015 Chinese Fir Trail
- 1400 Bethel Rd
- 1618 Brownairs Ln
- 1550 Brown Owl Dr
- 1712 Mayridge Ln
- 4408 Poplar Dr
- 2816 Erinridge Rd
- 2712 Patbrook Ln
- 2730 Erinridge Rd
- 1606 Oxleymare Dr
- 1610 Oxleymare Dr
- 644 Sunnybrook Rd
- 3325 Woodmeadow Pkwy
- 1009 Ridge Rock Rd
- 640 Sunnybrook Rd
- 1522 Mark Massengill Dr
- 1530 Mark Massengill Dr
- 1518 Mark Massengill Dr
- 1534 Mark Massengill Dr
- 1535 Tom Gipson Dr
- 1531 Tom Gipson Dr
- 1541 Tom Gipson Dr
- 1527 Tom Gipson Dr
- 1514 Mark Massengill Dr
- 1538 Mark Massengill Dr
- 1525 Mark Massengill Dr
- 1529 Mark Massengill Dr
- 1521 Mark Massengill Dr
- 1523 Tom Gipson Dr
- 1549 Tom Gipson Dr
- 1517 Mark Massengill Dr
- 1510 Mark Massengill Dr
- 1542 Mark Massengill Dr
- 1539 Mark Massengill Dr
- 1553 Tom Gipson Dr