Estimated Value: $367,000 - $482,000
3
Beds
2
Baths
1,436
Sq Ft
$297/Sq Ft
Est. Value
About This Home
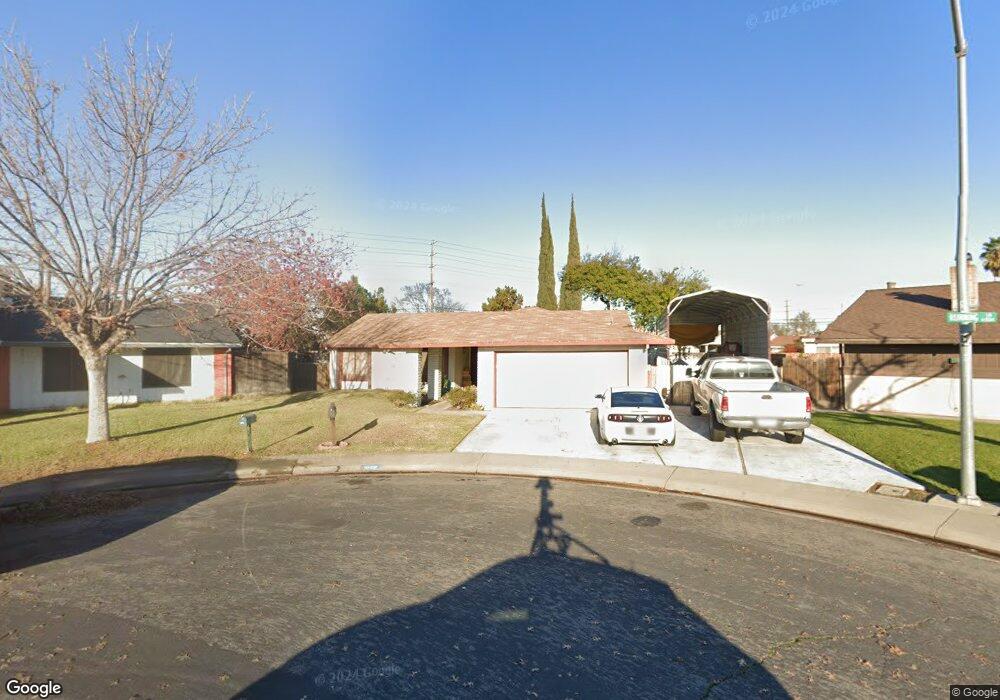
This home is located at 1526 Running Ln, Ceres, CA 95307 and is currently estimated at $426,528, approximately $297 per square foot. 1526 Running Ln is a home located in Stanislaus County with nearby schools including Carroll Fowler Elementary School, Mae Hensley Junior High School, and Ceres High School.
Ownership History
Date
Name
Owned For
Owner Type
Purchase Details
Closed on
Oct 31, 2017
Sold by
Lucas Paul Dean
Bought by
Lucas Genevieve B
Current Estimated Value
Purchase Details
Closed on
Oct 26, 2005
Sold by
Lucas Paul D and Lucas Leslie M
Bought by
Lucas Paul D
Home Financials for this Owner
Home Financials are based on the most recent Mortgage that was taken out on this home.
Original Mortgage
$132,000
Interest Rate
5.74%
Mortgage Type
New Conventional
Purchase Details
Closed on
Mar 26, 2002
Sold by
Lucas Paul D
Bought by
Lucas Paul D and Lucas Leslie M
Home Financials for this Owner
Home Financials are based on the most recent Mortgage that was taken out on this home.
Original Mortgage
$116,000
Interest Rate
6.84%
Purchase Details
Closed on
Mar 14, 2002
Sold by
Lucas Leslie M
Bought by
Lucas Paul D
Home Financials for this Owner
Home Financials are based on the most recent Mortgage that was taken out on this home.
Original Mortgage
$116,000
Interest Rate
6.84%
Create a Home Valuation Report for This Property
The Home Valuation Report is an in-depth analysis detailing your home's value as well as a comparison with similar homes in the area
Purchase History
| Date | Buyer | Sale Price | Title Company |
|---|---|---|---|
| Lucas Genevieve B | -- | None Available | |
| Lucas Paul D | -- | Old Republic | |
| Lucas Paul D | -- | Chicago Title Co | |
| Lucas Paul D | -- | Chicago Title Co |
Source: Public Records
Mortgage History
| Date | Status | Borrower | Loan Amount |
|---|---|---|---|
| Closed | Lucas Paul D | $132,000 | |
| Closed | Lucas Paul D | $116,000 |
Source: Public Records
Tax History
| Year | Tax Paid | Tax Assessment Tax Assessment Total Assessment is a certain percentage of the fair market value that is determined by local assessors to be the total taxable value of land and additions on the property. | Land | Improvement |
|---|---|---|---|---|
| 2025 | $2,655 | $233,636 | $82,782 | $150,854 |
| 2024 | $2,487 | $229,056 | $81,159 | $147,897 |
| 2023 | $2,418 | $224,566 | $79,568 | $144,998 |
| 2022 | $2,397 | $220,163 | $78,008 | $142,155 |
| 2021 | $2,373 | $215,847 | $76,479 | $139,368 |
| 2020 | $2,299 | $213,634 | $75,695 | $137,939 |
| 2019 | $2,283 | $209,446 | $74,211 | $135,235 |
| 2018 | $2,234 | $205,340 | $72,756 | $132,584 |
| 2017 | $2,215 | $201,315 | $71,330 | $129,985 |
| 2016 | $2,169 | $197,369 | $69,932 | $127,437 |
| 2015 | $2,139 | $194,405 | $68,882 | $125,523 |
| 2014 | $1,854 | $169,500 | $40,000 | $129,500 |
Source: Public Records
Map
Nearby Homes
- 2605 Glasgow Dr
- 1645 Moffett Rd
- 2511 E Hatch Rd
- 1647 Moffett Rd
- 2509 E Hatch Rd
- 1415 Villa Way
- 1655 Moffett Rd
- 1409 Villa Way
- 2409 Lavon Ln
- 2644 Parkway
- 2845 E Hatch Rd Unit 78
- 2845 E Hatch Rd Unit 86
- 2845 E Hatch Rd Unit 84
- 0 5th St
- 1017 Stillwater Ln
- 1821 Rose Ave
- 2816 Canyon Dr
- 2841 Fowler Rd Unit 33
- 1821 Myrtlewood Dr
- 1713 Pikake Ct
- 2517 Marguerite Way
- 1530 Running Ln
- 1527 Moffett Rd
- 1533 Moffett Rd
- 2513 Marguerite Way
- 1534 Running Ln
- 1537 Moffett Rd
- 1535 Running Ln
- 2509 Marguerite Way
- 9 E Hatch Rd
- 2521 Glasgow Dr
- 2517 Glasgow Dr
- 2508 Marguerite Way
- 1526 Moffett Rd
- 1522 Moffett Rd
- 1530 Moffett Rd
- 2505 Marguerite Way
- 1539 Running Ln
- 2504 Marguerite Way
- 2509 Glasgow Dr
Your Personal Tour Guide
Ask me questions while you tour the home.