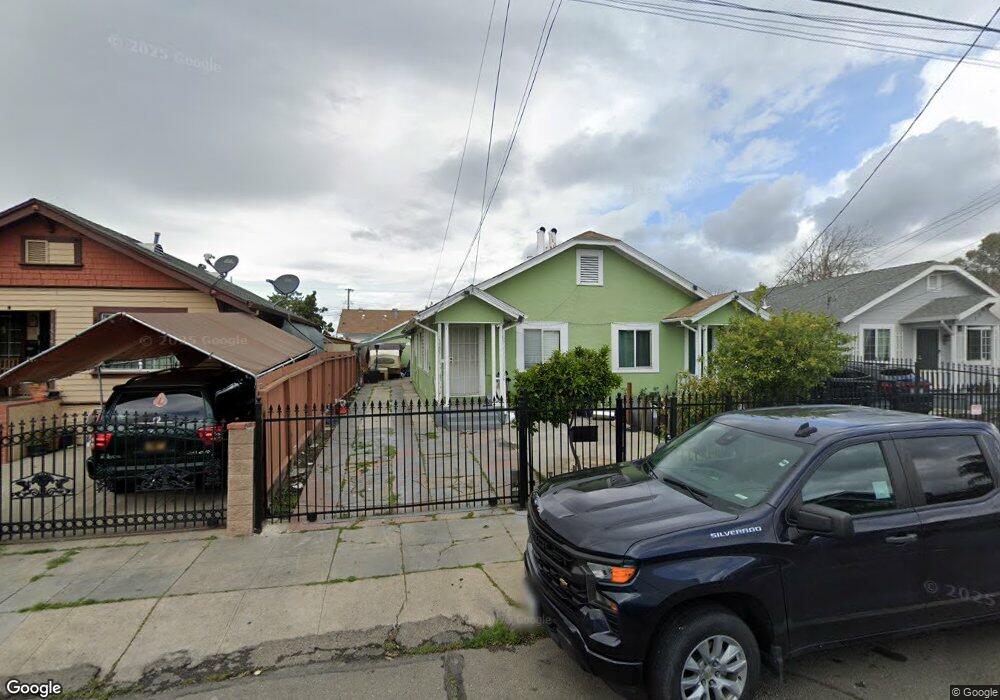
1527 88th Ave Oakland, CA 94621
Webster NeighborhoodEstimated Value: $496,000 - $586,000
2
Beds
2
Baths
1,504
Sq Ft
$365/Sq Ft
Est. Value
About This Home
This home is located at 1527 88th Ave, Oakland, CA 94621 and is currently estimated at $548,862, approximately $364 per square foot. 1527 88th Ave is a home located in Alameda County with nearby schools including East Oakland Pride Elementary School, Elmhurst United Middle School, and Coliseum College Prep Academy.
Ownership History
Date
Name
Owned For
Owner Type
Purchase Details
Closed on
Aug 18, 2021
Sold by
Lopez Luis A Herrera and Herrera Luis A
Bought by
Lopez Luis A Herrera and Moreno Gomez Pedro
Current Estimated Value
Purchase Details
Closed on
Feb 26, 2018
Sold by
Eydelshteyn Vladimir B
Bought by
Herrera Luis A
Home Financials for this Owner
Home Financials are based on the most recent Mortgage that was taken out on this home.
Original Mortgage
$480,142
Interest Rate
4.12%
Mortgage Type
FHA
Purchase Details
Closed on
May 7, 2008
Sold by
Lasalle Bank Na
Bought by
Eydelshteyn Vladimir B
Purchase Details
Closed on
Jun 6, 2007
Sold by
Cherry Lamar
Bought by
Lasalle Bank Na and Mlmi Trust
Purchase Details
Closed on
Dec 27, 2005
Sold by
Cowan Leslie A
Bought by
Cherry Lamar
Home Financials for this Owner
Home Financials are based on the most recent Mortgage that was taken out on this home.
Original Mortgage
$394,400
Interest Rate
7.94%
Mortgage Type
Balloon
Purchase Details
Closed on
Mar 25, 2005
Sold by
Mann Gurpreet and Mann Parampaul K
Bought by
Cowan Leslie A
Home Financials for this Owner
Home Financials are based on the most recent Mortgage that was taken out on this home.
Original Mortgage
$266,000
Interest Rate
5.37%
Mortgage Type
Purchase Money Mortgage
Purchase Details
Closed on
Dec 26, 2002
Sold by
Pickens Lula M and Estate Of Joseph C Trimble
Bought by
Mann Parampaul K and Mann Gupreet
Home Financials for this Owner
Home Financials are based on the most recent Mortgage that was taken out on this home.
Original Mortgage
$198,000
Interest Rate
5.93%
Purchase Details
Closed on
Oct 4, 2001
Sold by
Trimble Joseph C and Trimble Sharon L
Bought by
Trimble Joseph C
Home Financials for this Owner
Home Financials are based on the most recent Mortgage that was taken out on this home.
Original Mortgage
$140,000
Interest Rate
9.25%
Create a Home Valuation Report for This Property
The Home Valuation Report is an in-depth analysis detailing your home's value as well as a comparison with similar homes in the area
Home Values in the Area
Average Home Value in this Area
Purchase History
| Date | Buyer | Sale Price | Title Company |
|---|---|---|---|
| Lopez Luis A Herrera | $500,000 | None Available | |
| Herrera Luis A | $489,000 | Chicago Title Company | |
| Eydelshteyn Vladimir B | $110,500 | Lsi Title Fnds Division | |
| Lasalle Bank Na | $3,000 | None Available | |
| Cherry Lamar | $493,000 | Chicago Title Company | |
| Cowan Leslie A | $380,000 | Chicago Title Co | |
| Mann Parampaul K | $220,000 | Chicago Title Co | |
| Trimble Joseph C | -- | Old Republic Title Company |
Source: Public Records
Mortgage History
| Date | Status | Borrower | Loan Amount |
|---|---|---|---|
| Previous Owner | Herrera Luis A | $480,142 | |
| Previous Owner | Cherry Lamar | $394,400 | |
| Previous Owner | Cowan Leslie A | $266,000 | |
| Previous Owner | Mann Parampaul K | $198,000 | |
| Previous Owner | Trimble Joseph C | $140,000 | |
| Closed | Cowan Leslie A | $57,000 |
Source: Public Records
Tax History Compared to Growth
Tax History
| Year | Tax Paid | Tax Assessment Tax Assessment Total Assessment is a certain percentage of the fair market value that is determined by local assessors to be the total taxable value of land and additions on the property. | Land | Improvement |
|---|---|---|---|---|
| 2025 | $9,313 | $556,388 | $166,916 | $389,472 |
| 2024 | $9,313 | $545,478 | $163,643 | $381,835 |
| 2023 | $9,701 | $534,784 | $160,435 | $374,349 |
| 2022 | $9,357 | $524,300 | $157,290 | $367,010 |
| 2021 | $8,855 | $514,021 | $154,206 | $359,815 |
| 2020 | $8,754 | $508,754 | $152,626 | $356,128 |
| 2019 | $8,365 | $498,780 | $149,634 | $349,146 |
| 2018 | $3,216 | $125,055 | $37,460 | $87,595 |
| 2017 | $3,039 | $122,603 | $36,725 | $85,878 |
| 2016 | $2,859 | $120,199 | $36,005 | $84,194 |
| 2015 | $2,836 | $118,396 | $35,465 | $82,931 |
| 2014 | $2,801 | $116,077 | $34,770 | $81,307 |
Source: Public Records
Map
Nearby Homes