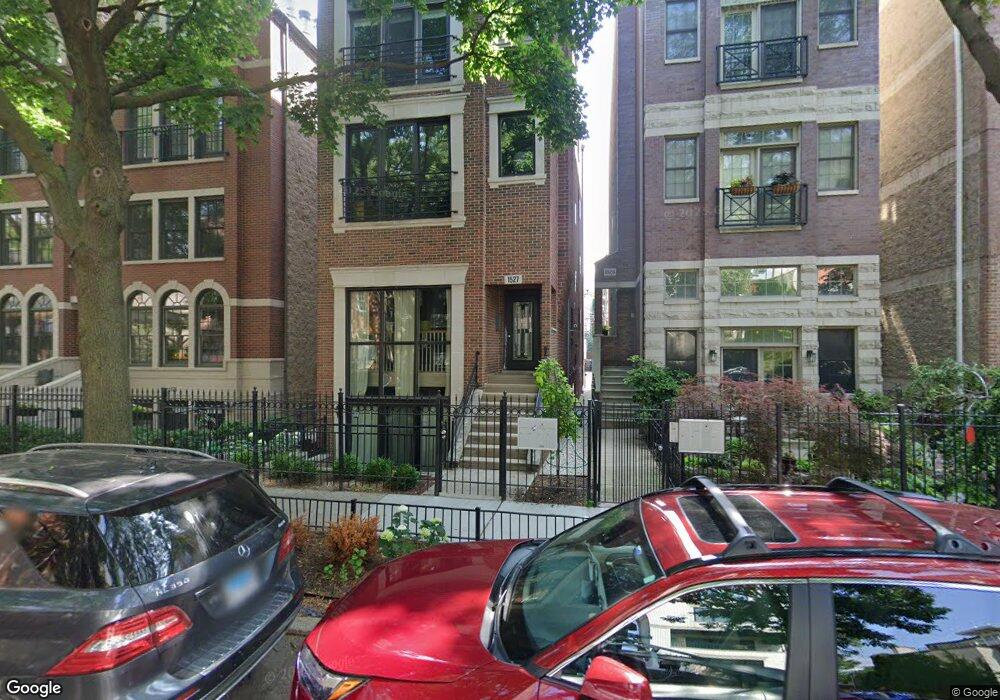
1527 N Mohawk St Unit 2 Chicago, IL 60610
Old Town NeighborhoodEstimated Value: $548,578 - $732,000
2
Beds
2
Baths
1,600
Sq Ft
$390/Sq Ft
Est. Value
About This Home
This home is located at 1527 N Mohawk St Unit 2, Chicago, IL 60610 and is currently estimated at $623,895, approximately $389 per square foot. 1527 N Mohawk St Unit 2 is a home located in Cook County with nearby schools including Manierre Elementary School, Lincoln Park High School, and Catherine Cook School.
Ownership History
Date
Name
Owned For
Owner Type
Purchase Details
Closed on
Aug 29, 2017
Sold by
Pagh Adam
Bought by
Adams Brothers Enterprises Llc
Current Estimated Value
Purchase Details
Closed on
May 17, 2013
Sold by
Krajewski Lauri and Niedermaier Lauri
Bought by
Pagh Adam
Home Financials for this Owner
Home Financials are based on the most recent Mortgage that was taken out on this home.
Original Mortgage
$370,500
Interest Rate
3.62%
Mortgage Type
New Conventional
Purchase Details
Closed on
Oct 10, 2002
Sold by
Bankfinancial Fsb
Bought by
Niedermaier Brad and Krajewski Lauri
Home Financials for this Owner
Home Financials are based on the most recent Mortgage that was taken out on this home.
Original Mortgage
$300,000
Interest Rate
5.12%
Create a Home Valuation Report for This Property
The Home Valuation Report is an in-depth analysis detailing your home's value as well as a comparison with similar homes in the area
Home Values in the Area
Average Home Value in this Area
Purchase History
| Date | Buyer | Sale Price | Title Company |
|---|---|---|---|
| Adams Brothers Enterprises Llc | $480,000 | Greater Metropolitan Title L | |
| Pagh Adam | $390,000 | None Available | |
| Niedermaier Brad | $379,000 | Chicago Title Insurance Co |
Source: Public Records
Mortgage History
| Date | Status | Borrower | Loan Amount |
|---|---|---|---|
| Previous Owner | Pagh Adam | $370,500 | |
| Previous Owner | Niedermaier Brad | $300,000 | |
| Closed | Niedermaier Brad | $41,000 |
Source: Public Records
Tax History Compared to Growth
Tax History
| Year | Tax Paid | Tax Assessment Tax Assessment Total Assessment is a certain percentage of the fair market value that is determined by local assessors to be the total taxable value of land and additions on the property. | Land | Improvement |
|---|---|---|---|---|
| 2024 | $9,072 | $46,240 | $10,489 | $35,751 |
| 2023 | $8,844 | $43,000 | $8,459 | $34,541 |
| 2022 | $8,844 | $43,000 | $8,459 | $34,541 |
| 2021 | $8,647 | $42,998 | $8,458 | $34,540 |
| 2020 | $9,476 | $42,538 | $7,105 | $35,433 |
| 2019 | $9,310 | $46,340 | $7,105 | $39,235 |
| 2018 | $9,154 | $46,340 | $7,105 | $39,235 |
| 2017 | $6,884 | $35,355 | $5,752 | $29,603 |
| 2016 | $7,081 | $35,355 | $5,752 | $29,603 |
| 2015 | $6,479 | $35,355 | $5,752 | $29,603 |
| 2014 | $6,824 | $36,780 | $4,263 | $32,517 |
| 2013 | $6,211 | $36,780 | $4,263 | $32,517 |
Source: Public Records
Map
Nearby Homes
- 1503 N Mohawk St Unit 2E
- 1523 N Cleveland Ave Unit 2S
- 1414 N Mohawk St
- 1428 N Mohawk St Unit A
- 437 W North Ave Unit 404
- 1623 N Mohawk St
- 1543 N Hudson Ave Unit 2
- 1547 N Hudson Ave Unit 1
- 1648 N Cleveland Ave
- 557 W Eugenie St Unit 557
- 1509 N Sedgwick St
- 1329 N Mohawk St Unit 1
- 1444 N Orleans St Unit 6E
- 1444 N Orleans St Unit G39
- 1444 N Orleans St Unit G47
- 1444 N Orleans St Unit G45
- 1444 N Orleans St Unit G41
- 1500 N Orleans St Unit 3N
- 1630 N Sedgwick St Unit 2
- 1546 N Orleans St Unit 708
- 1527 N Mohawk St Unit 1
- 1527 N Mohawk St Unit 4
- 1523 N Mohawk St
- 1523 N Mohawk St Unit 2
- 1523 N Mohawk St Unit 1
- 1523 N Mohawk St Unit 3
- 1523 N Mohawk St Unit 4
- 1531 N Mohawk St Unit 3N
- 1531 N Mohawk St Unit 2N
- 1531 N Mohawk St Unit 1N
- 1529 N Mohawk St Unit 1
- 1529 N Mohawk St Unit 31
- 1529 N Mohawk St Unit 2S
- 1529 N Mohawk St Unit 1S
- 1529 N Mohawk St Unit 3N
- 1529 N Mohawk St Unit 3S
- 1519 N Mohawk St Unit 300
- 1519 N Mohawk St Unit 500
- 1519 N Mohawk St Unit 400
- 1519 N Mohawk St Unit 200