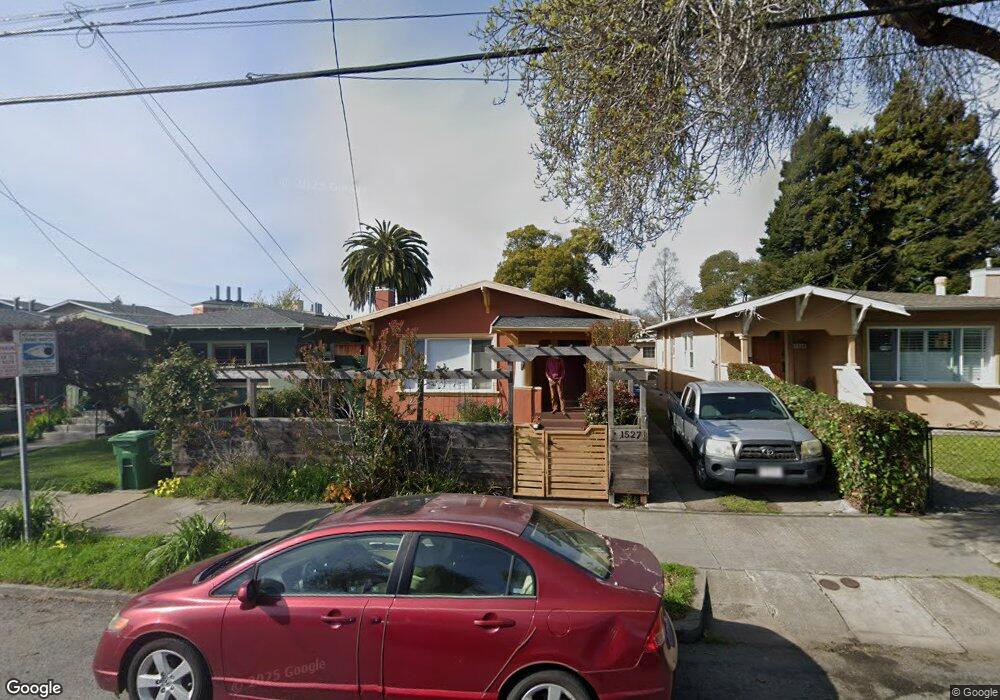
1527 Parker St Berkeley, CA 94703
South Berkeley NeighborhoodEstimated Value: $1,154,032 - $1,480,000
2
Beds
1
Bath
1,048
Sq Ft
$1,217/Sq Ft
Est. Value
About This Home
This home is located at 1527 Parker St, Berkeley, CA 94703 and is currently estimated at $1,275,011, approximately $1,216 per square foot. 1527 Parker St is a home located in Alameda County with nearby schools including Washington Elementary School, Malcolm X Elementary School, and Oxford Elementary School.
Ownership History
Date
Name
Owned For
Owner Type
Purchase Details
Closed on
Jan 22, 2018
Sold by
Parrish Paul D
Bought by
Parrish Paul D
Current Estimated Value
Home Financials for this Owner
Home Financials are based on the most recent Mortgage that was taken out on this home.
Original Mortgage
$125,000
Outstanding Balance
$105,458
Interest Rate
3.93%
Mortgage Type
New Conventional
Estimated Equity
$1,169,553
Purchase Details
Closed on
Mar 7, 2016
Sold by
Whitley Alice P
Bought by
Parrish Paul D
Purchase Details
Closed on
May 21, 2013
Sold by
Mantra Group Llc
Bought by
Parrish Paul D and Whitley Alice P
Purchase Details
Closed on
Sep 17, 2012
Sold by
Newman Sara and Addison Barbara
Bought by
Mantra Group Llc
Create a Home Valuation Report for This Property
The Home Valuation Report is an in-depth analysis detailing your home's value as well as a comparison with similar homes in the area
Home Values in the Area
Average Home Value in this Area
Purchase History
| Date | Buyer | Sale Price | Title Company |
|---|---|---|---|
| Parrish Paul D | -- | Old Republic Title Company | |
| Parrish Paul D | -- | None Available | |
| Parrish Paul D | $541,500 | Chicago Title Company | |
| Mantra Group Llc | $285,000 | Chicago Title Company |
Source: Public Records
Mortgage History
| Date | Status | Borrower | Loan Amount |
|---|---|---|---|
| Open | Parrish Paul D | $125,000 |
Source: Public Records
Tax History Compared to Growth
Tax History
| Year | Tax Paid | Tax Assessment Tax Assessment Total Assessment is a certain percentage of the fair market value that is determined by local assessors to be the total taxable value of land and additions on the property. | Land | Improvement |
|---|---|---|---|---|
| 2025 | $13,976 | $843,602 | $199,852 | $650,750 |
| 2024 | $13,976 | $826,927 | $195,935 | $637,992 |
| 2023 | $13,623 | $817,577 | $192,093 | $625,484 |
| 2022 | $13,310 | $794,551 | $188,328 | $613,223 |
| 2021 | $13,749 | $778,835 | $184,635 | $601,200 |
| 2020 | $12,612 | $777,781 | $182,743 | $595,038 |
| 2019 | $12,107 | $762,535 | $179,161 | $583,374 |
| 2018 | $11,521 | $675,821 | $175,649 | $500,172 |
| 2017 | $8,777 | $574,335 | $172,205 | $402,130 |
| 2016 | $8,510 | $563,076 | $168,829 | $394,247 |
| 2015 | $8,392 | $554,621 | $166,294 | $388,327 |
| 2014 | $8,330 | $543,756 | $163,036 | $380,720 |
Source: Public Records
Map
Nearby Homes
- 1524 Blake St
- 1516 Blake St
- 1516 Blake St Unit A
- 1612 Parker St
- 1606 Derby St
- 1431 Dwight Way
- 2437 Acton St
- 1711 Carleton St
- 2750 Sacramento St
- 1450 Ward St
- 2758 Sacramento St
- 1726 Parker St Unit 2
- 1726 Parker St Unit 1
- 2774 Sacramento St
- 2782 Sacramento St
- 2790 Sacramento St
- 2728 Dohr St
- 1540 Stuart St
- 2533 Grant St
- 2701 Grant St