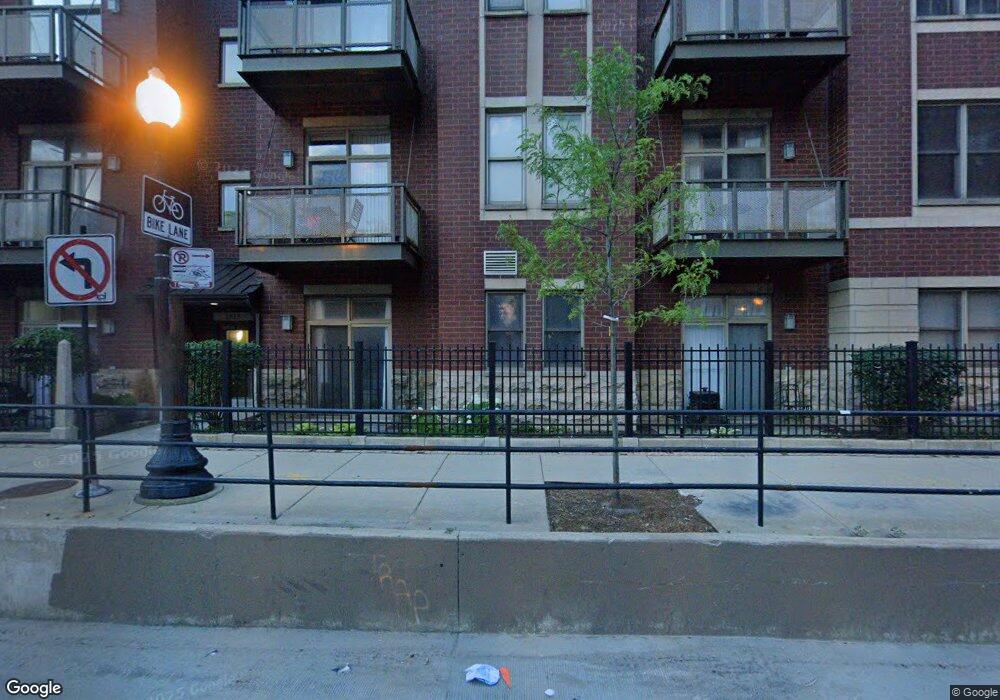
1527 S Halsted St Unit 211 Chicago, IL 60607
Little Italy NeighborhoodEstimated Value: $231,000 - $259,000
--
Bed
--
Bath
--
Sq Ft
0.65
Acres
About This Home
This home is located at 1527 S Halsted St Unit 211, Chicago, IL 60607 and is currently estimated at $243,795. 1527 S Halsted St Unit 211 is a home located in Cook County with nearby schools including John M. Smyth Elementary I.B. World School, Wells Community Academy High School, and Youth Connection Leadership Academy.
Ownership History
Date
Name
Owned For
Owner Type
Purchase Details
Closed on
Sep 9, 2019
Sold by
Mbh Group Llc
Bought by
Chinta Bhanudeepti
Current Estimated Value
Home Financials for this Owner
Home Financials are based on the most recent Mortgage that was taken out on this home.
Original Mortgage
$209,000
Outstanding Balance
$183,442
Interest Rate
3.7%
Mortgage Type
New Conventional
Estimated Equity
$60,353
Purchase Details
Closed on
Sep 29, 2008
Sold by
Hurley Amy L
Bought by
Mbh Group Llc
Purchase Details
Closed on
Nov 27, 2006
Sold by
South Campus Development Team Llc
Bought by
Hurley Amy L
Home Financials for this Owner
Home Financials are based on the most recent Mortgage that was taken out on this home.
Original Mortgage
$180,000
Interest Rate
6.47%
Mortgage Type
Purchase Money Mortgage
Create a Home Valuation Report for This Property
The Home Valuation Report is an in-depth analysis detailing your home's value as well as a comparison with similar homes in the area
Home Values in the Area
Average Home Value in this Area
Purchase History
| Date | Buyer | Sale Price | Title Company |
|---|---|---|---|
| Chinta Bhanudeepti | $230,000 | Old Republic Title | |
| Mbh Group Llc | $220,000 | Fidelity National Title | |
| Hurley Amy L | $200,000 | Near North National Title |
Source: Public Records
Mortgage History
| Date | Status | Borrower | Loan Amount |
|---|---|---|---|
| Open | Chinta Bhanudeepti | $209,000 | |
| Previous Owner | Hurley Amy L | $180,000 |
Source: Public Records
Tax History Compared to Growth
Tax History
| Year | Tax Paid | Tax Assessment Tax Assessment Total Assessment is a certain percentage of the fair market value that is determined by local assessors to be the total taxable value of land and additions on the property. | Land | Improvement |
|---|---|---|---|---|
| 2024 | $3,862 | $20,261 | $3,858 | $16,403 |
| 2023 | $3,765 | $18,242 | $2,342 | $15,900 |
| 2022 | $3,765 | $18,242 | $2,342 | $15,900 |
| 2021 | $3,680 | $18,241 | $2,342 | $15,899 |
| 2020 | $3,517 | $15,735 | $2,342 | $13,393 |
| 2019 | $2,784 | $17,242 | $2,342 | $14,900 |
| 2018 | $2,736 | $17,242 | $2,342 | $14,900 |
| 2017 | $1,714 | $11,311 | $2,066 | $9,245 |
| 2016 | $1,765 | $11,311 | $2,066 | $9,245 |
| 2015 | $1,592 | $11,311 | $2,066 | $9,245 |
| 2014 | $1,723 | $11,855 | $1,756 | $10,099 |
| 2013 | $1,678 | $11,855 | $1,756 | $10,099 |
Source: Public Records
Map
Nearby Homes
- 743 W 15th St
- 1512 S Halsted St
- 811 W 15th Place Unit 709
- 811 W 15th Place Unit 708
- 811 W 15th Place Unit 513
- 811 W 15th Place Unit 806E
- 1610 S Halsted St Unit 504
- 833 W 15th Place Unit 606W
- 833 W 15th Place Unit 514E
- 834 W Village Ct
- 718 W 17th St Unit 1W
- 1415 S Halsted St Unit 1A
- 1416 S Emerald Ave
- 1524 S Sangamon St Unit 802
- 1524 S Sangamon St Unit 401
- 1524 S Sangamon St Unit 413-S
- 1524 S Sangamon St Unit 512
- 1524 S Sangamon St Unit 414S
- 1525 S Sangamon St Unit 315P
- 1525 S Sangamon St Unit 711P
- 1527 S Halsted St Unit 203
- 1527 S Halsted St Unit 201
- 1527 S Halsted St Unit 108
- 1527 S Halsted St Unit 105
- 1527 S Halsted St Unit 103
- 1527 S Halsted St Unit 313
- 1527 S Halsted St Unit 311
- 1527 S Halsted St Unit 309
- 1527 S Halsted St Unit 305
- 1527 S Halsted St Unit 303
- 1527 S Halsted St Unit 210
- 1527 S Halsted St Unit 209
- 767 W 15th St Unit 208
- 1527 S Halsted St Unit 207
- 1527 S Halsted St Unit 205
- 1527 S Halsted St Unit 107
- 1527 S Halsted St Unit 109
- 1527 S Halsted St Unit 106
- 1527 S Halsted St Unit 308
- 767 W 15th St Unit 308