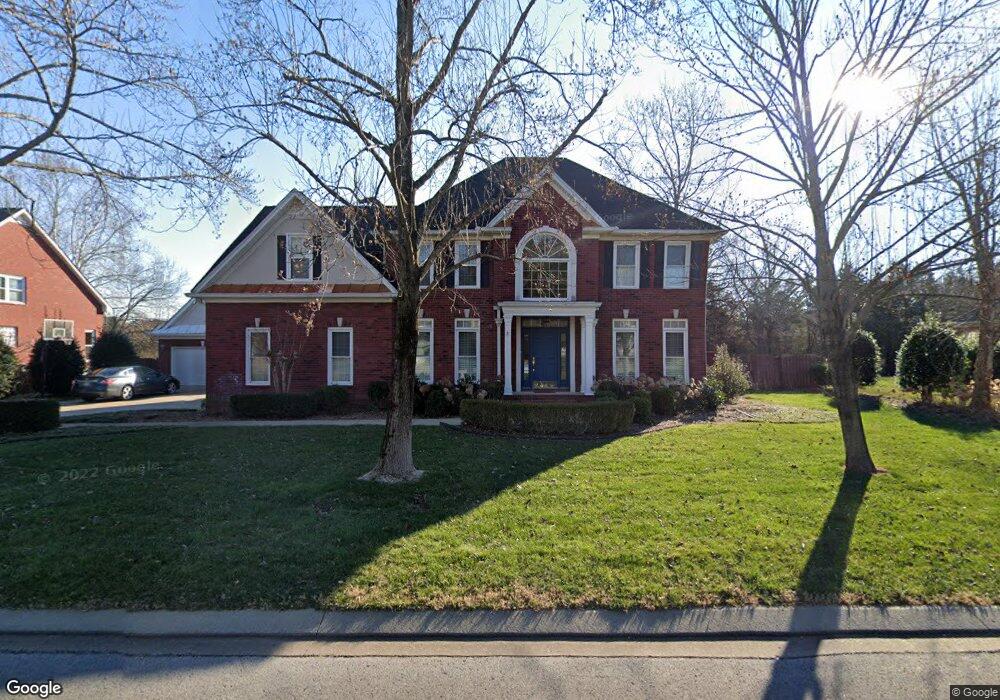
1527 Shagbark Trail Murfreesboro, TN 37130
Estimated Value: $787,000 - $911,000
Studio
4
Baths
3,397
Sq Ft
$246/Sq Ft
Est. Value
About This Home
This home is located at 1527 Shagbark Trail, Murfreesboro, TN 37130 and is currently estimated at $836,272, approximately $246 per square foot. 1527 Shagbark Trail is a home located in Rutherford County with nearby schools including John Pittard Elementary School, Oakland Middle School, and Oakland High School.
Ownership History
Date
Name
Owned For
Owner Type
Purchase Details
Closed on
Sep 28, 2004
Sold by
Fitzgerald William J
Bought by
Wolf Kevin M and Wolf Anne D
Current Estimated Value
Home Financials for this Owner
Home Financials are based on the most recent Mortgage that was taken out on this home.
Original Mortgage
$300,000
Interest Rate
5.75%
Purchase Details
Closed on
Mar 20, 2002
Sold by
Gardner Walter E
Bought by
David Mccurley
Home Financials for this Owner
Home Financials are based on the most recent Mortgage that was taken out on this home.
Original Mortgage
$231,900
Interest Rate
6.25%
Purchase Details
Closed on
May 1, 1995
Sold by
Blankenship John T
Bought by
North Woods Ltd
Purchase Details
Closed on
Feb 6, 1995
Sold by
Northwoods Ltd
Bought by
Blankenship John T
Create a Home Valuation Report for This Property
The Home Valuation Report is an in-depth analysis detailing your home's value as well as a comparison with similar homes in the area
Home Values in the Area
Average Home Value in this Area
Purchase History
| Date | Buyer | Sale Price | Title Company |
|---|---|---|---|
| Wolf Kevin M | $375,000 | -- | |
| David Mccurley | $289,900 | -- | |
| North Woods Ltd | -- | -- | |
| Blankenship John T | $70,000 | -- |
Source: Public Records
Mortgage History
| Date | Status | Borrower | Loan Amount |
|---|---|---|---|
| Closed | Blankenship John T | $300,000 | |
| Previous Owner | Blankenship John T | $231,900 |
Source: Public Records
Tax History
| Year | Tax Paid | Tax Assessment Tax Assessment Total Assessment is a certain percentage of the fair market value that is determined by local assessors to be the total taxable value of land and additions on the property. | Land | Improvement |
|---|---|---|---|---|
| 2025 | $4,481 | $158,400 | $21,250 | $137,150 |
| 2024 | $4,481 | $158,400 | $21,250 | $137,150 |
| 2023 | $2,972 | $158,400 | $21,250 | $137,150 |
| 2022 | $2,560 | $158,400 | $21,250 | $137,150 |
| 2021 | $2,417 | $108,925 | $21,250 | $87,675 |
| 2020 | $2,417 | $108,925 | $21,250 | $87,675 |
| 2019 | $2,417 | $108,925 | $21,250 | $87,675 |
| 2018 | $3,321 | $108,925 | $0 | $0 |
| 2017 | $4,098 | $105,450 | $0 | $0 |
| 2016 | $4,098 | $105,450 | $0 | $0 |
| 2015 | $4,098 | $105,450 | $0 | $0 |
| 2014 | $2,622 | $105,450 | $0 | $0 |
| 2013 | -- | $102,475 | $0 | $0 |
Source: Public Records
Map
Nearby Homes
- 1728 Shagbark Trail
- 2111 White Poplar Ct
- 1518 Anatole Ct
- 1409 E Northfield Blvd
- 1445 Bradberry Dr
- 1812 Mosaic Trail
- 1325 E Northfield Blvd
- 1503 Bradberry Dr
- 2164 White Poplar Ct
- 1504 Winterberry Dr
- 2127 Patriot Dr
- 2403 English Hill Dr
- 2116 Goby Dr
- 2475 Oak Hill Dr
- 1208 Lenox Cove
- 2422 English Hill Dr
- 2116 Herring Crossing
- 788 Dejarnette Ln
- 2342 N Tennessee Blvd Unit 1203
- 2342 N Tennessee Blvd Unit 601
- 1523 Shagbark Trail
- 1531 Shagbark Trail
- 1519 Shagbark Trail
- 1603 Shagbark Trail
- 1431 Northwoods Cove
- 1522 Shagbark Trail
- 1467 Avellino Cir
- 1471 Avellino Cir
- 1518 Shagbark Trail
- 1434 Northwoods Cove
- 1607 Shagbark Trail
- 1515 Shagbark Trail
- 1475 Avellino Cir
- 1427 Northwoods Cove
- 1463 Avellino Cir
- 1514 Shagbark Trail
- 1606 Shagbark Trail
- 1483 Avellino Cir
- 1510 Shagbark Trail
Your Personal Tour Guide
Ask me questions while you tour the home.