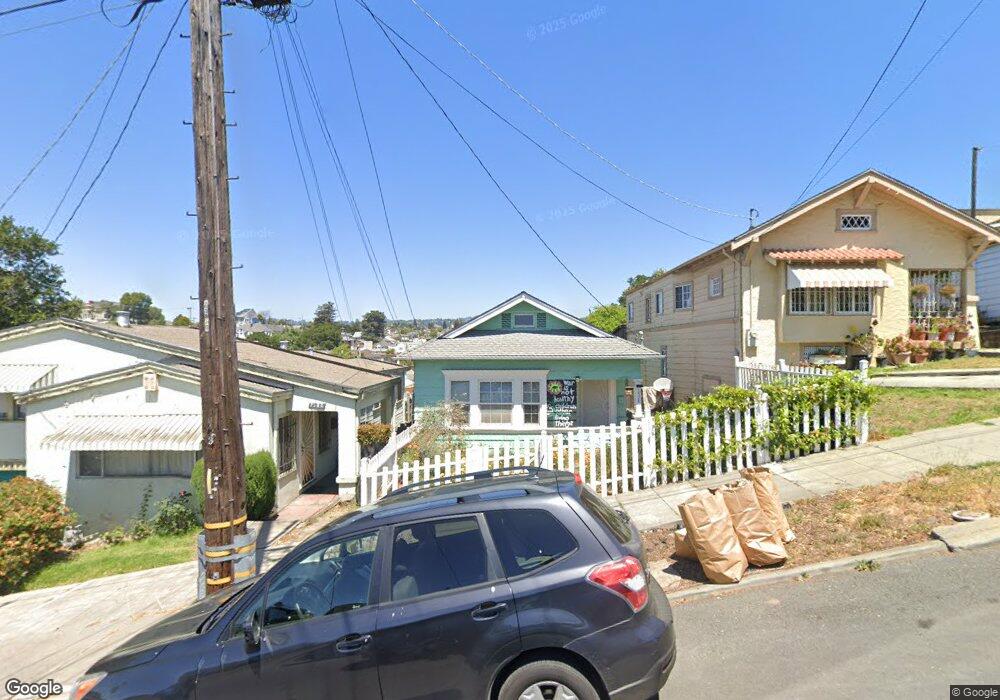
1528 E 19th St Oakland, CA 94606
San Antonio NeighborhoodEstimated Value: $572,000 - $843,000
3
Beds
2
Baths
1,118
Sq Ft
$617/Sq Ft
Est. Value
About This Home
This home is located at 1528 E 19th St, Oakland, CA 94606 and is currently estimated at $690,271, approximately $617 per square foot. 1528 E 19th St is a home located in Alameda County with nearby schools including Garfield Elementary School, Roosevelt Middle School, and Oakland High School.
Ownership History
Date
Name
Owned For
Owner Type
Purchase Details
Closed on
May 22, 2015
Sold by
King Kenneth F and Malvey Rosemary M
Bought by
Couch Benjamin B and Couch Olivia F
Current Estimated Value
Home Financials for this Owner
Home Financials are based on the most recent Mortgage that was taken out on this home.
Original Mortgage
$408,000
Outstanding Balance
$313,623
Interest Rate
3.62%
Mortgage Type
New Conventional
Estimated Equity
$376,648
Purchase Details
Closed on
Sep 12, 2003
Sold by
Mt Sinai Community Development Corp
Bought by
King Kenneth F and Malvey Rosemary M
Home Financials for this Owner
Home Financials are based on the most recent Mortgage that was taken out on this home.
Original Mortgage
$191,000
Interest Rate
6.17%
Mortgage Type
Purchase Money Mortgage
Purchase Details
Closed on
Aug 7, 2002
Sold by
Musgrove Lelton D and Musgrove Nina M
Bought by
Mount Sinai Community Development Corp
Home Financials for this Owner
Home Financials are based on the most recent Mortgage that was taken out on this home.
Original Mortgage
$147,150
Interest Rate
6.29%
Create a Home Valuation Report for This Property
The Home Valuation Report is an in-depth analysis detailing your home's value as well as a comparison with similar homes in the area
Home Values in the Area
Average Home Value in this Area
Purchase History
| Date | Buyer | Sale Price | Title Company |
|---|---|---|---|
| Couch Benjamin B | $510,000 | First American Title Company | |
| King Kenneth F | $331,000 | Alliance Title Company | |
| Mount Sinai Community Development Corp | $196,500 | Financial Title Company |
Source: Public Records
Mortgage History
| Date | Status | Borrower | Loan Amount |
|---|---|---|---|
| Open | Couch Benjamin B | $408,000 | |
| Previous Owner | King Kenneth F | $191,000 | |
| Previous Owner | Mount Sinai Community Development Corp | $147,150 | |
| Closed | Mount Sinai Community Development Corp | $79,050 |
Source: Public Records
Tax History
| Year | Tax Paid | Tax Assessment Tax Assessment Total Assessment is a certain percentage of the fair market value that is determined by local assessors to be the total taxable value of land and additions on the property. | Land | Improvement |
|---|---|---|---|---|
| 2025 | $9,334 | $605,922 | $183,876 | $429,046 |
| 2024 | $9,334 | $593,907 | $180,272 | $420,635 |
| 2023 | $9,786 | $589,125 | $176,737 | $412,388 |
| 2022 | $9,525 | $570,574 | $173,272 | $404,302 |
| 2021 | $9,101 | $559,252 | $169,875 | $396,377 |
| 2020 | $9,001 | $560,448 | $168,134 | $392,314 |
| 2019 | $8,658 | $549,463 | $164,839 | $384,624 |
| 2018 | $8,478 | $538,691 | $161,607 | $377,084 |
| 2017 | $8,152 | $528,130 | $158,439 | $369,691 |
| 2016 | $7,974 | $517,777 | $155,333 | $362,444 |
| 2015 | $5,408 | $325,000 | $97,500 | $227,500 |
| 2014 | -- | $310,000 | $93,000 | $217,000 |
Source: Public Records
Map
Nearby Homes
- 1641 E 20th St
- 1737 13th Ave
- 1736 E 21st St
- 1839 Commerce Way
- 1739 E 22nd St
- 1533 14th Ave
- 1747 E 22nd St
- 2212 17th Ave
- 1515 14th Ave Unit 302
- 1515 14th Ave Unit 305
- 1140 E 22nd St
- 1418 15th Ave
- 1504 13th Ave
- 2301 12th Ave
- 2138 19th Ave
- 925 E 19th St
- 2036 E 20th St
- 1538 20th Ave
- 1925 E 15th St
- 836 E 19th St
Your Personal Tour Guide
Ask me questions while you tour the home.