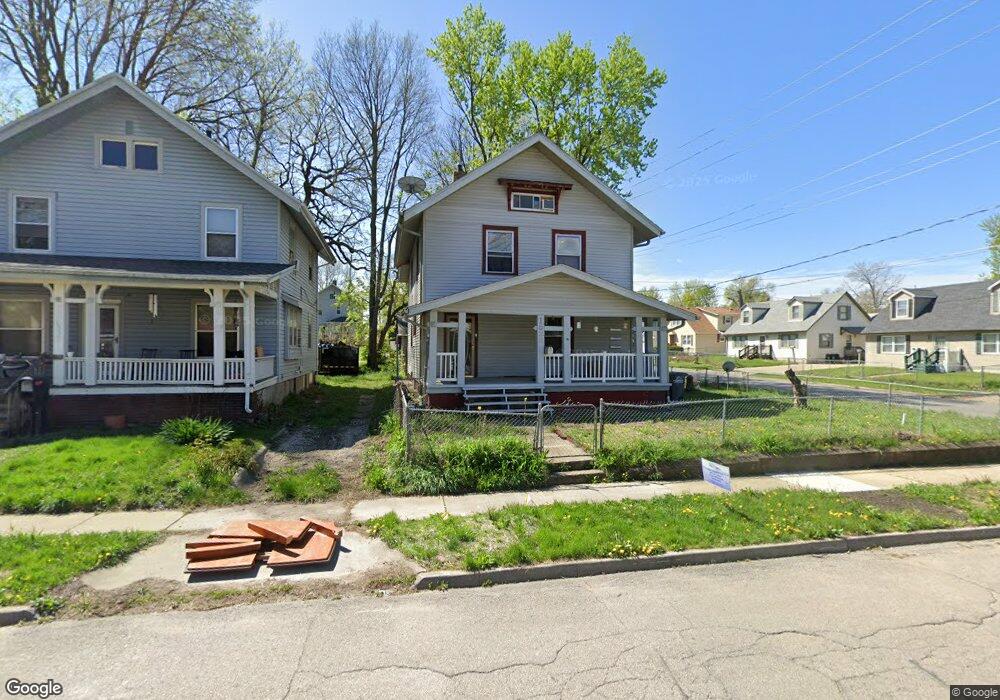
1528 Harrison Ave Des Moines, IA 50314
King Irving NeighborhoodEstimated Value: $122,000 - $146,000
4
Beds
2
Baths
1,444
Sq Ft
$94/Sq Ft
Est. Value
About This Home
This home is located at 1528 Harrison Ave, Des Moines, IA 50314 and is currently estimated at $136,019, approximately $94 per square foot. 1528 Harrison Ave is a home located in Polk County with nearby schools including King Elementary School, Callanan Middle School, and Roosevelt High School.
Ownership History
Date
Name
Owned For
Owner Type
Purchase Details
Closed on
May 2, 2023
Sold by
Tong Paul Le
Bought by
Greene Joseph M
Current Estimated Value
Home Financials for this Owner
Home Financials are based on the most recent Mortgage that was taken out on this home.
Original Mortgage
$118,698
Outstanding Balance
$115,289
Interest Rate
6.42%
Mortgage Type
VA
Estimated Equity
$20,730
Purchase Details
Closed on
Aug 28, 2018
Sold by
Vannguyen Sau Van and Nguyen Thao Thu Thi
Bought by
Tong Paul
Purchase Details
Closed on
Oct 21, 2011
Sold by
Tran Xuong
Bought by
Tong Lan
Purchase Details
Closed on
Mar 31, 2010
Sold by
Tong Donadoni
Bought by
Tran Xuong
Purchase Details
Closed on
Jan 9, 2008
Sold by
Duoc Tong
Bought by
Donadoni Tran Xuong and Donadoni Tong
Purchase Details
Closed on
Jun 25, 1998
Sold by
Vantong Son Van
Bought by
Tong Duoc V
Create a Home Valuation Report for This Property
The Home Valuation Report is an in-depth analysis detailing your home's value as well as a comparison with similar homes in the area
Home Values in the Area
Average Home Value in this Area
Purchase History
| Date | Buyer | Sale Price | Title Company |
|---|---|---|---|
| Greene Joseph M | $120,000 | None Listed On Document | |
| Tong Paul | $25,000 | None Available | |
| Tong Lan | -- | None Available | |
| Tran Xuong | -- | None Available | |
| Donadoni Tran Xuong | -- | None Available | |
| Tong Duoc V | -- | -- |
Source: Public Records
Mortgage History
| Date | Status | Borrower | Loan Amount |
|---|---|---|---|
| Open | Greene Joseph M | $118,698 |
Source: Public Records
Tax History Compared to Growth
Tax History
| Year | Tax Paid | Tax Assessment Tax Assessment Total Assessment is a certain percentage of the fair market value that is determined by local assessors to be the total taxable value of land and additions on the property. | Land | Improvement |
|---|---|---|---|---|
| 2025 | $1,702 | $104,000 | $13,600 | $90,400 |
| 2024 | $1,702 | $86,500 | $11,700 | $74,800 |
| 2023 | $1,492 | $86,500 | $11,700 | $74,800 |
| 2022 | $1,480 | $63,300 | $8,900 | $54,400 |
| 2021 | $1,394 | $63,300 | $8,900 | $54,400 |
| 2020 | $1,450 | $55,900 | $7,900 | $48,000 |
| 2019 | $994 | $55,900 | $7,900 | $48,000 |
| 2018 | $978 | $45,500 | $7,000 | $38,500 |
| 2017 | $1,006 | $45,500 | $7,000 | $38,500 |
| 2016 | $974 | $45,700 | $7,000 | $38,700 |
| 2015 | $974 | $45,700 | $7,000 | $38,700 |
| 2014 | $836 | $40,200 | $6,800 | $33,400 |
Source: Public Records
Map
Nearby Homes
- 1443 17th St
- 1457 17th St
- 1414 Harrison Ave
- 1341 Clark St
- 1534 18th St
- 1347 Forest Ave
- 1330 Clark St
- 1608 Mondamin Ave
- 1716 Mondamin Ave
- 1434 Martin Luther King Junior Pkwy
- 1503 13th St
- 1622 Martin Luther King Junior Pkwy
- 1440 21st St
- 1505 University Ave
- 1414 Goddard Ct
- 1423 12th St
- 1615 Jefferson Ave
- 1916 Jefferson Ave
- 1656 Martin Luther King Junior Pkwy
- 1609 12th St
- 1526 Harrison Ave
- 1520 Harrison Ave
- 1409 16th St
- 1412 16th St
- 1516 Harrison Ave
- 1426 16th St
- 1525 Forest Ave
- 1410 16th St
- 1430 16th St
- 1527 Forest Ave
- 1527 Forest Corner
- 1523 Forest Ave
- 1529 Harrison Ave
- 1408 16th St
- 1527 Harrison Ave
- 1434 16th St
- 1603 Forest Ave
- 1521 Harrison Ave
- 1438 16th St
- 1519 Forest Ave