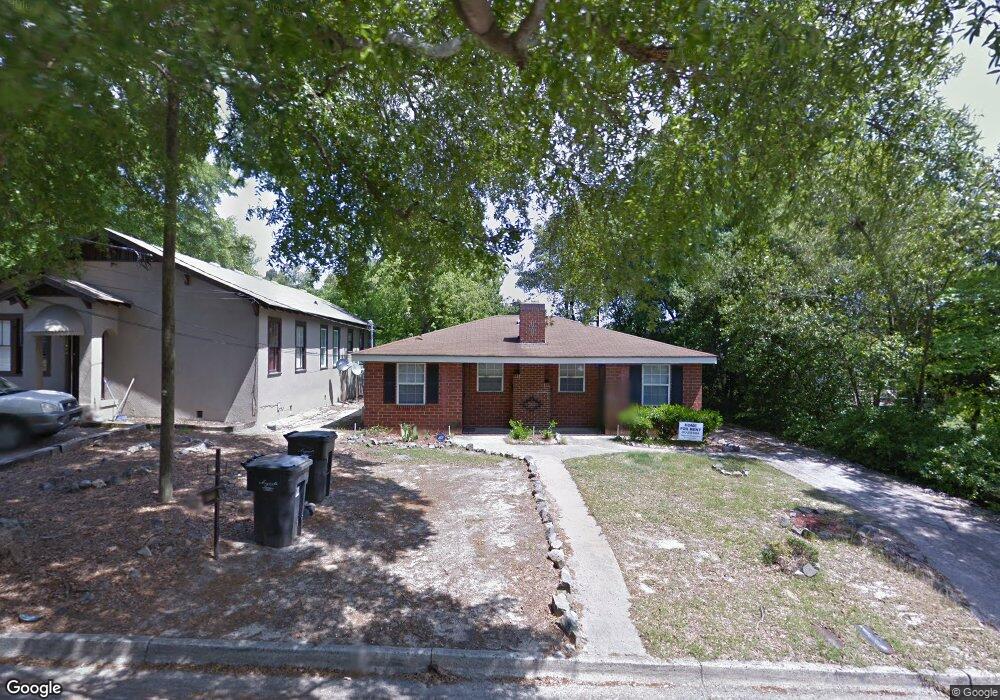
1528 Stovall St Augusta, GA 30904
Highland Park NeighborhoodEstimated Value: $175,000 - $198,000
2
Beds
2
Baths
944
Sq Ft
$198/Sq Ft
Est. Value
About This Home
This home is located at 1528 Stovall St, Augusta, GA 30904 and is currently estimated at $186,766, approximately $197 per square foot. 1528 Stovall St is a home located in Richmond County with nearby schools including R.B. Hunt Elementary School, Monte Sano Elementary School, and Langford Middle School.
Ownership History
Date
Name
Owned For
Owner Type
Purchase Details
Closed on
Jun 27, 2023
Sold by
Hoffmann J Christian
Bought by
Halpin Sarah E
Current Estimated Value
Home Financials for this Owner
Home Financials are based on the most recent Mortgage that was taken out on this home.
Original Mortgage
$135,000
Outstanding Balance
$131,646
Interest Rate
6.79%
Mortgage Type
New Conventional
Estimated Equity
$55,120
Purchase Details
Closed on
Apr 10, 2007
Sold by
Bowles Susan L
Bought by
Hoffmann Christian and Hoffman Deborah G
Home Financials for this Owner
Home Financials are based on the most recent Mortgage that was taken out on this home.
Original Mortgage
$55,900
Interest Rate
6.1%
Mortgage Type
Purchase Money Mortgage
Purchase Details
Closed on
May 23, 1989
Sold by
Bailie Donald H
Bought by
Lazenby Karen P Bowles Susan L
Purchase Details
Closed on
May 1, 1989
Sold by
Bailie Donald H
Bought by
Lazenby Karen P
Create a Home Valuation Report for This Property
The Home Valuation Report is an in-depth analysis detailing your home's value as well as a comparison with similar homes in the area
Home Values in the Area
Average Home Value in this Area
Purchase History
| Date | Buyer | Sale Price | Title Company |
|---|---|---|---|
| Halpin Sarah E | $180,000 | -- | |
| Hoffmann Christian | $69,900 | None Available | |
| Lazenby Karen P Bowles Susan L | -- | -- | |
| Lazenby Karen P | $38,200 | -- |
Source: Public Records
Mortgage History
| Date | Status | Borrower | Loan Amount |
|---|---|---|---|
| Open | Halpin Sarah E | $135,000 | |
| Previous Owner | Hoffmann Christian | $55,900 |
Source: Public Records
Tax History Compared to Growth
Tax History
| Year | Tax Paid | Tax Assessment Tax Assessment Total Assessment is a certain percentage of the fair market value that is determined by local assessors to be the total taxable value of land and additions on the property. | Land | Improvement |
|---|---|---|---|---|
| 2025 | $2,392 | $62,016 | $6,004 | $56,012 |
| 2024 | $2,392 | $55,240 | $6,004 | $49,236 |
| 2023 | $2,074 | $50,652 | $6,004 | $44,648 |
| 2022 | $1,592 | $36,839 | $6,004 | $30,835 |
| 2021 | $1,228 | $22,706 | $6,004 | $16,702 |
| 2020 | $1,216 | $22,706 | $6,004 | $16,702 |
| 2019 | $1,313 | $23,925 | $6,004 | $17,921 |
| 2018 | $1,321 | $23,925 | $6,004 | $17,921 |
| 2017 | $1,316 | $23,925 | $6,004 | $17,921 |
| 2016 | $1,316 | $23,925 | $6,004 | $17,921 |
| 2015 | $1,322 | $23,925 | $6,004 | $17,921 |
| 2014 | $1,323 | $23,925 | $6,004 | $17,921 |
Source: Public Records
Map
Nearby Homes
- 1516 Johns Rd
- 1514 Heath St
- 2349 Wrightsboro Rd
- 2232 Lee St
- 1608 Winter St
- 1611 Pendleton Rd
- 1327 Milledge Rd
- 2409 Central Ave
- 1433 Troupe St
- 1621 Pendleton Rd
- 1435 Troupe St
- 1437 Troupe St
- 2225 Kimberly Dr
- 2212 Central Ave
- 1526 Craig St
- 1613 Kissingbower Rd
- 2220 Kings Way
- 815 Johns Rd
- 2607 Mckibben St
- 2442 Mcdowell St
- 1526&1528 Stovall St
- 1526 Stovall St
- 1512 Stovall St Unit A
- 1512 Stovall St Unit 2
- 1512 Stovall St Unit 1
- 1512 Stovall St
- 1527 Johns Rd
- 1525 Johns Rd
- 1529 Johns Rd
- 1532 Stovall St
- 1533 Stovall St
- 1523 Johns Rd
- 1535 Stovall St
- 1531 Johns Rd
- 1521 Johns Rd
- 1520 Stovall St
- 1539 Stovall St Unit 2
- 1537 Stovall St
- 1519 Johns Rd