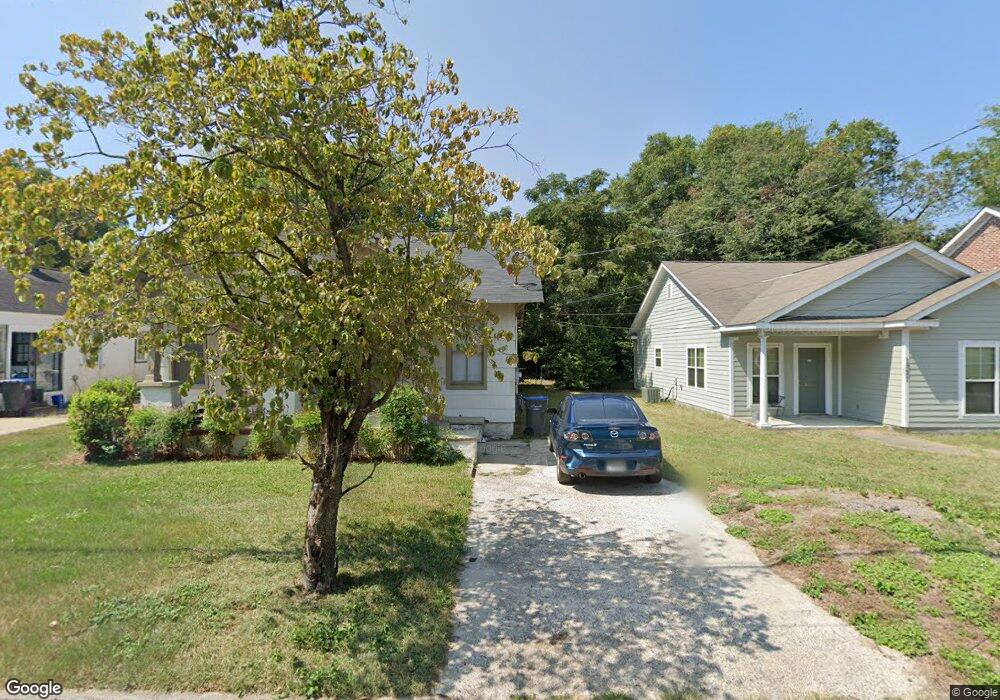
1529 Craig St Augusta, GA 30904
Summerville NeighborhoodEstimated Value: $177,000 - $271,000
2
Beds
2
Baths
1,506
Sq Ft
$137/Sq Ft
Est. Value
About This Home
This home is located at 1529 Craig St, Augusta, GA 30904 and is currently estimated at $206,442, approximately $137 per square foot. 1529 Craig St is a home located in Richmond County with nearby schools including R.B. Hunt Elementary School, Monte Sano Elementary School, and Langford Middle School.
Ownership History
Date
Name
Owned For
Owner Type
Purchase Details
Closed on
May 4, 2020
Sold by
Dgbjsh Family Properties Llc
Bought by
Amer76 Llc
Current Estimated Value
Purchase Details
Closed on
Jun 16, 2006
Sold by
Miller David A
Bought by
Dgbjsh Family Properties Llc
Purchase Details
Closed on
Oct 14, 1999
Sold by
Southtrust Bank Na
Bought by
Miller David
Home Financials for this Owner
Home Financials are based on the most recent Mortgage that was taken out on this home.
Original Mortgage
$39,200
Interest Rate
7.85%
Mortgage Type
Purchase Money Mortgage
Purchase Details
Closed on
Mar 18, 1998
Sold by
S & B Company Inc
Bought by
Southtrust Bank Na
Purchase Details
Closed on
May 5, 1994
Sold by
Davidson Matha M
Bought by
Kay Mary Jo
Purchase Details
Closed on
Sep 10, 1992
Sold by
Kay Mary Jo
Bought by
Davidson Martha M
Purchase Details
Closed on
Apr 1, 1987
Sold by
Dougherty Stephen E
Bought by
Davidson Martha M
Create a Home Valuation Report for This Property
The Home Valuation Report is an in-depth analysis detailing your home's value as well as a comparison with similar homes in the area
Home Values in the Area
Average Home Value in this Area
Purchase History
| Date | Buyer | Sale Price | Title Company |
|---|---|---|---|
| Amer76 Llc | -- | -- | |
| Dgbjsh Family Properties Llc | -- | None Available | |
| Miller David | $49,000 | -- | |
| Southtrust Bank Na | -- | -- | |
| Kay Mary Jo | -- | -- | |
| Davidson Martha M | -- | -- | |
| Davidson Martha M | $30,000 | -- |
Source: Public Records
Mortgage History
| Date | Status | Borrower | Loan Amount |
|---|---|---|---|
| Previous Owner | Miller David | $39,200 |
Source: Public Records
Tax History Compared to Growth
Tax History
| Year | Tax Paid | Tax Assessment Tax Assessment Total Assessment is a certain percentage of the fair market value that is determined by local assessors to be the total taxable value of land and additions on the property. | Land | Improvement |
|---|---|---|---|---|
| 2025 | $1,619 | $45,471 | $18,821 | $26,650 |
| 2024 | $1,619 | $38,430 | $18,821 | $19,609 |
| 2023 | $1,589 | $35,698 | $18,821 | $16,877 |
| 2022 | $1,616 | $37,611 | $18,821 | $18,790 |
| 2021 | $1,609 | $34,031 | $18,821 | $15,210 |
| 2020 | $1,220 | $22,834 | $9,800 | $13,034 |
| 2019 | $1,274 | $22,834 | $9,800 | $13,034 |
| 2018 | $1,282 | $22,834 | $9,800 | $13,034 |
| 2017 | $1,277 | $22,834 | $9,800 | $13,034 |
| 2016 | $1,277 | $22,834 | $9,800 | $13,034 |
| 2015 | $1,361 | $22,834 | $9,800 | $13,034 |
| 2014 | $1,439 | $22,834 | $9,800 | $13,034 |
Source: Public Records
Map
Nearby Homes
- 1526 Craig St
- 2619 Raymond Ave
- 2632 Raymond Ave
- 2603 Wrightsboro Rd
- 2607 Mckibben St
- 1744 Pennsylvania Ave
- 2442 Mcdowell St
- 2349 Wrightsboro Rd
- 1811 Pennsylvania Ave
- 1514 Heath St
- 1833 Pennsylvania Ave
- 1425 Glenn Ave
- 1516 Johns Rd
- 1916 Ohio Ave
- 1141 Arsenal Ave
- 815 Johns Rd
- 1117 Highland Ave
- 2602 Walton Way
- 2904 Lombardy Ct
- 2232 Lee St
- 1533 Craig St
- 1527 Craig St
- 1541 Craig St
- 1525 Craig St
- 1522 Monte Sano Ave
- 1520 Monte Sano Ave
- 1524 Monte Sano Ave
- 1543 Craig St
- 1528 Craig St
- 1536 Craig St
- 1547 Craig St
- 1540 Craig St
- 1524 Craig St
- 1530 Monte Sano Ave
- 1544 Craig St
- 2471 Wrightsboro Rd
- 1532 Monte Sano Ave
- 1504 Monte Sano Ave
- 1518 Craig St
- 1519 Monte Sano Ave