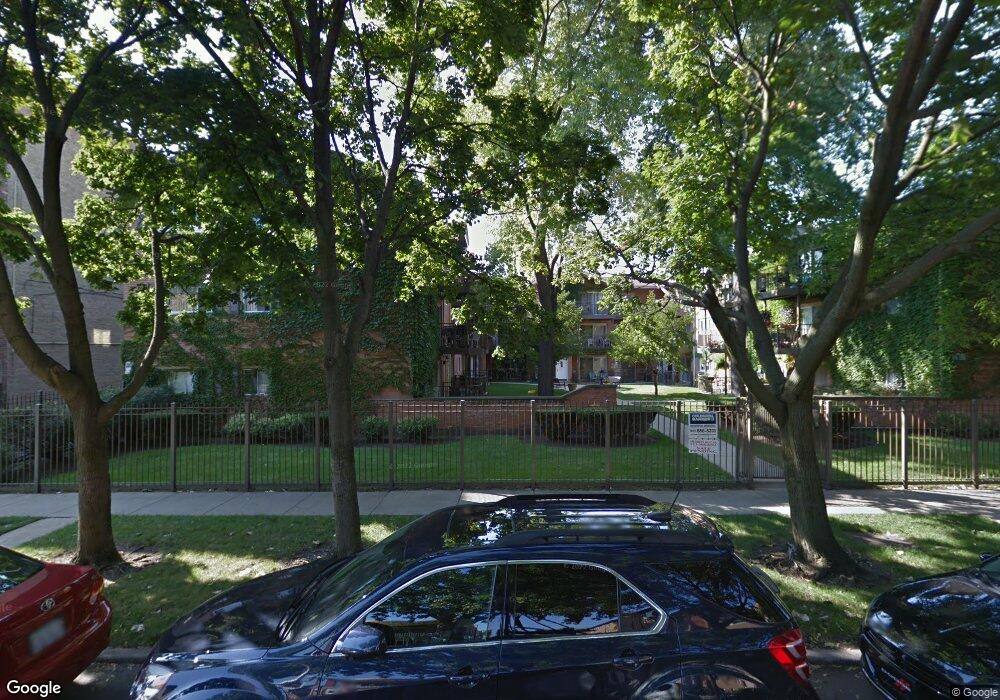
1529 W Farwell Ave Unit 15291S Chicago, IL 60626
Rogers Park NeighborhoodEstimated Value: $197,000 - $265,443
2
Beds
--
Bath
--
Sq Ft
0.58
Acres
About This Home
This home is located at 1529 W Farwell Ave Unit 15291S, Chicago, IL 60626 and is currently estimated at $235,361. 1529 W Farwell Ave Unit 15291S is a home located in Cook County with nearby schools including Kilmer Elementary School, Sullivan High School, and Chicago Math and Science Academy.
Ownership History
Date
Name
Owned For
Owner Type
Purchase Details
Closed on
Jan 14, 2016
Sold by
Orr Judith K
Bought by
Casey Patrick and Delong Richard K
Current Estimated Value
Home Financials for this Owner
Home Financials are based on the most recent Mortgage that was taken out on this home.
Original Mortgage
$80,000
Outstanding Balance
$33,869
Interest Rate
3.87%
Mortgage Type
New Conventional
Estimated Equity
$201,492
Purchase Details
Closed on
Jun 16, 2004
Sold by
Donovan William
Bought by
Orr Judith K
Home Financials for this Owner
Home Financials are based on the most recent Mortgage that was taken out on this home.
Original Mortgage
$151,600
Interest Rate
5.75%
Mortgage Type
Unknown
Purchase Details
Closed on
Nov 20, 2001
Sold by
1529 & 37 W Farwell Venture Corp
Bought by
Donovan William
Create a Home Valuation Report for This Property
The Home Valuation Report is an in-depth analysis detailing your home's value as well as a comparison with similar homes in the area
Home Values in the Area
Average Home Value in this Area
Purchase History
| Date | Buyer | Sale Price | Title Company |
|---|---|---|---|
| Casey Patrick | $100,000 | Chicago Title Insurance Co | |
| Orr Judith K | $189,500 | First American | |
| Donovan William | $155,000 | -- |
Source: Public Records
Mortgage History
| Date | Status | Borrower | Loan Amount |
|---|---|---|---|
| Open | Casey Patrick | $80,000 | |
| Previous Owner | Orr Judith K | $151,600 | |
| Closed | Orr Judith K | $28,400 |
Source: Public Records
Tax History Compared to Growth
Tax History
| Year | Tax Paid | Tax Assessment Tax Assessment Total Assessment is a certain percentage of the fair market value that is determined by local assessors to be the total taxable value of land and additions on the property. | Land | Improvement |
|---|---|---|---|---|
| 2024 | $2,538 | $21,685 | $2,141 | $19,544 |
| 2023 | $3,702 | $18,000 | $1,713 | $16,287 |
| 2022 | $3,702 | $18,000 | $1,713 | $16,287 |
| 2021 | $3,619 | $17,999 | $1,712 | $16,287 |
| 2020 | $2,844 | $12,768 | $1,379 | $11,389 |
| 2019 | $2,860 | $14,233 | $1,379 | $12,854 |
| 2018 | $2,812 | $14,233 | $1,379 | $12,854 |
| 2017 | $2,131 | $9,901 | $1,237 | $8,664 |
| 2016 | $1,983 | $9,901 | $1,237 | $8,664 |
| 2015 | $2,170 | $11,844 | $1,237 | $10,607 |
| 2014 | $2,093 | $11,283 | $1,141 | $10,142 |
| 2013 | $1,232 | $11,283 | $1,141 | $10,142 |
Source: Public Records
Map
Nearby Homes
- 1515 W Pratt Blvd Unit 1
- 6818 N Ashland Blvd Unit 1A
- 1643 W Farwell Ave Unit 3N
- 6737 N Greenview Ave Unit 2S
- 1411 W Farwell Ave Unit E2
- 1657 W Farwell Ave Unit 1D
- 1658 W Farwell Ave Unit GC
- 1634 W Morse Ave Unit C
- 1634 W Morse Ave
- 1630 W Columbia Ave Unit GN
- 1627 W Columbia Ave Unit GW
- 1415 W Lunt Ave Unit 207
- 6712 N Glenwood Ave Unit 2
- 6648 N Newgard Ave Unit 2
- 6753 N Hermitage Ave Unit 3B
- 6753 N Hermitage Ave
- 7021 N Greenview Ave Unit G
- 1339 W Lunt Ave Unit 2N
- 6755 N Hermitage Ave Unit 2
- 6755 N Hermitage Ave Unit 1
- 1535 W Farwell Ave Unit 2S
- 1535 W Farwell Ave Unit 15352S
- 1529 W Farwell Ave Unit 15293S
- 1529 W Farwell Ave Unit 15292N
- 1529 W Farwell Ave Unit 15292S
- 1533 W Farwell Ave Unit 15331S
- 1529 W Farwell Ave Unit 15293N
- 1529 W Farwell Ave Unit 15291N
- 1535 W Farwell Ave Unit 15351S
- 1535 W Farwell Ave Unit 15352N
- 1535 W Farwell Ave Unit 15351N
- 1535 W Farwell Ave Unit 15353S
- 1533 W Farwell Ave Unit 15333S
- 1535 W Farwell Ave Unit 15353N
- 1533 W Farwell Ave Unit 15332S
- 1529 W Farwell Ave Unit 3N
- 1535 W Farwell Ave Unit 3N
- 1529 W Farwell Ave Unit 3S
- 1529 W Farwell Ave Unit 1N
- 1533 W Farwell Ave Unit 1S