
Seller's Agent in 2026
Suzanne Hill
Coldwell Banker Kinard Realty - Dalton
(706) 483-2261
106 Total Sales
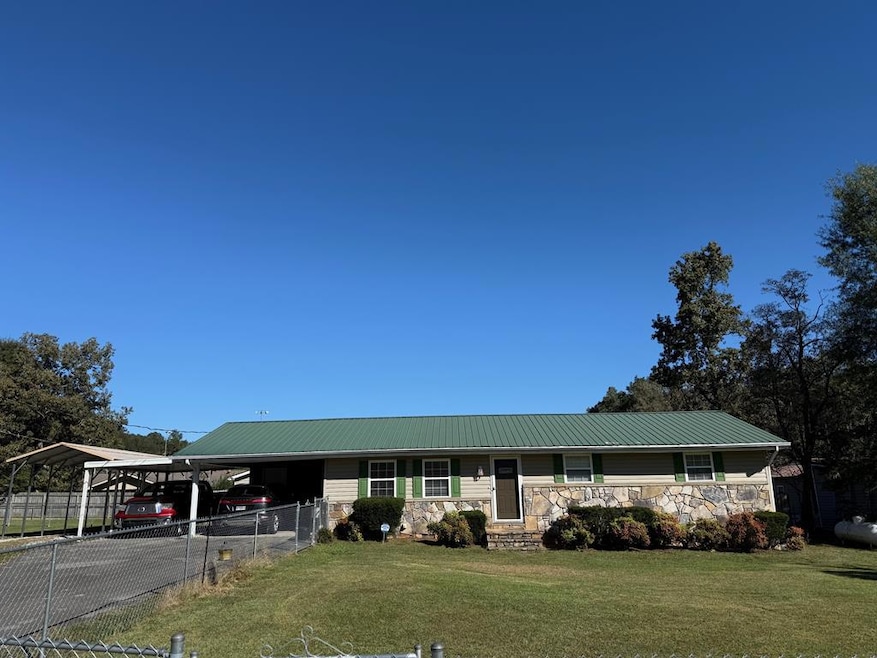
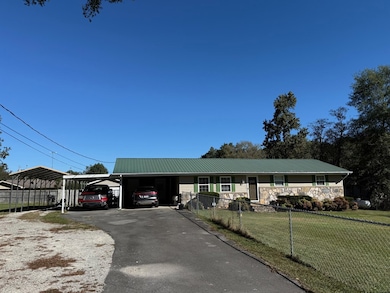
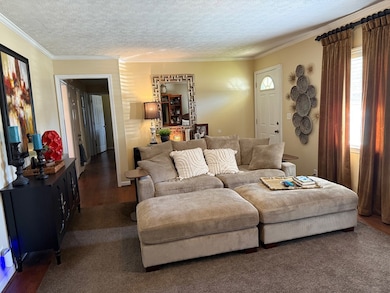
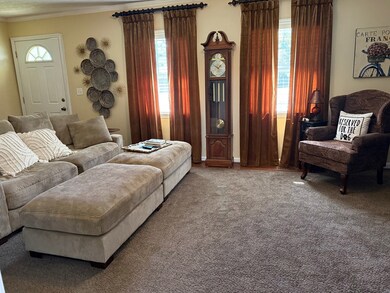
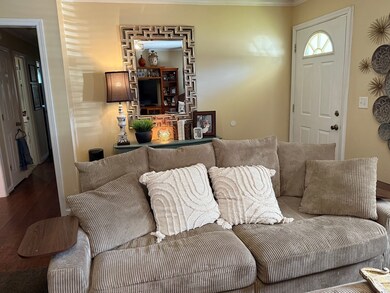
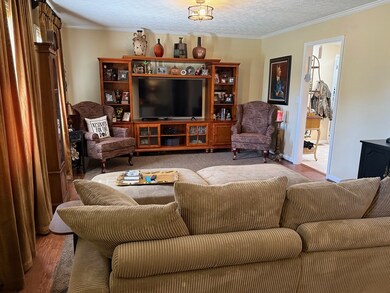
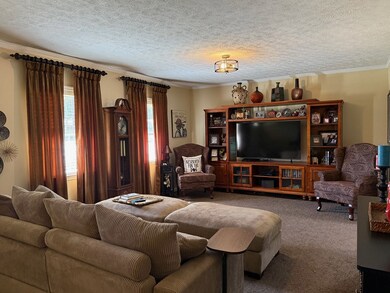
Charming 3 bedroom, 2 bath Stone and Vinyl Ranch home on a nice level lot with fenced in yard. Offering a perfect blend of comfort and convenience, this home features a spacious single level layout ideal for families and home time home buyers. Large living room with hardwood floors. Kitchen with tile flooring and white cabinets with tile countertops and newer stainless steel appliances. Large dining room with chair rail and hardwood floors. Enjoy swimming in the pool in the summer and grilling on the large back deck. You'll love being close to Pleasant Grove Park for exercise.
Last Agent to Sell the Property
Coldwell Banker Kinard Realty - Dalton Brokerage Email: 7062265182, brandy@kinardrealty.com License #36885 Listed on: 10/15/2025
| Date | Type | Sale Price | Title Company |
|---|---|---|---|
| Quit Claim Deed | -- | None Listed On Document | |
| Quit Claim Deed | -- | None Listed On Document | |
| Warranty Deed | $123,000 | -- | |
| Deed | $95,000 | -- | |
| Deed | -- | -- |
| Date | Status | Loan Amount | Loan Type |
|---|---|---|---|
| Open | $55,250 | New Conventional | |
| Closed | $55,250 | New Conventional | |
| Previous Owner | $76,000 | New Conventional |
| Date | Event | Price | List to Sale | Price per Sq Ft |
|---|---|---|---|---|
| 02/10/2026 02/10/26 | Sold | $248,000 | +0.9% | $190 / Sq Ft |
| 12/01/2025 12/01/25 | Pending | -- | -- | -- |
| 11/20/2025 11/20/25 | Price Changed | $245,900 | -1.6% | $189 / Sq Ft |
| 11/03/2025 11/03/25 | Price Changed | $249,900 | -2.0% | $192 / Sq Ft |
| 10/15/2025 10/15/25 | For Sale | $255,000 | -- | $196 / Sq Ft |
| Year | Tax Paid | Tax Assessment Tax Assessment Total Assessment is a certain percentage of the fair market value that is determined by local assessors to be the total taxable value of land and additions on the property. | Land | Improvement |
|---|---|---|---|---|
| 2025 | $1,413 | $71,404 | $12,000 | $59,404 |
| 2024 | $1,413 | $71,404 | $12,000 | $59,404 |
| 2023 | $1,317 | $50,773 | $9,000 | $41,773 |
| 2022 | $793 | $35,432 | $9,000 | $26,432 |
| 2021 | $793 | $35,432 | $9,000 | $26,432 |
| 2020 | $808 | $35,432 | $9,000 | $26,432 |
| 2019 | $816 | $35,432 | $9,000 | $26,432 |
| 2018 | $824 | $35,432 | $9,000 | $26,432 |
| 2017 | $824 | $35,432 | $9,000 | $26,432 |
| 2016 | $659 | $30,606 | $5,250 | $25,356 |
| 2014 | $625 | $30,606 | $5,250 | $25,356 |
| 2013 | -- | $30,606 | $5,250 | $25,356 |
Seller's Agent in 2026
Suzanne Hill
Coldwell Banker Kinard Realty - Dalton
(706) 483-2261
106 Total Sales
Buyer's Agent in 2026
David Cabero
RE/MAX
(762) 231-0101
81 Total Sales
Source: Carpet Capital Association of REALTORS®
MLS Number: 131161
APN: 12-064-07-023
Ask me questions while you tour the home.